如何使用 Matplotlib 在子图中添加 A, B, C 等注释
参考: Annotate Subplots in a Figure with A, B, C using Matplotlib
在数据可视化的过程中,使用子图(subplots)可以有效地在一个图形窗口中展示多个视图或数据集。Matplotlib 是一个非常强大的 Python 绘图库,它提供了丰富的接口来创建和定制各种图表,包括如何在子图中添加注释。本文将详细介绍如何使用 Matplotlib 在子图中添加 A, B, C 等注释,以帮助观众更好地理解图中的各个部分。
1. 基本概念
在开始具体的代码示例之前,我们首先需要了解一些基本概念和设置。在 Matplotlib 中,figure 对象可以被看作是一个可以容纳多个子图的画布。每个子图都是一个 axes 对象,可以在其中绘制各种图形和添加注释。
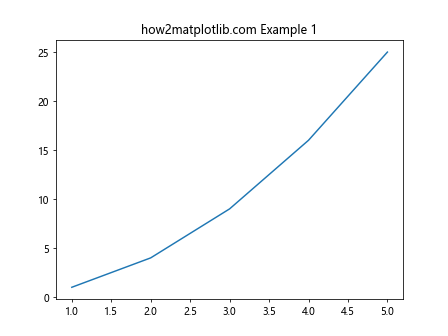
示例代码 1: 创建一个简单的子图
import matplotlib.pyplot as plt

# 创建一个图形和一个子图
fig, ax = plt.subplots()
ax.plot([1, 2, 3, 4, 5], [1, 4, 9, 16, 25])
ax.set_title("how2matplotlib.com Example 1")
plt.show()
Output:
2. 在子图中添加注释
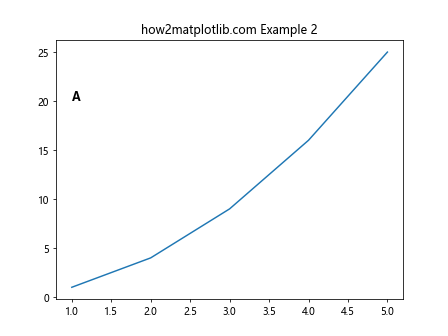
添加注释是一个重要的步骤,可以使图形更加易于理解。在 Matplotlib 中,可以使用 text 方法在子图中添加文本注释。
示例代码 2: 在子图中添加文本注释
import matplotlib.pyplot as plt

# 创建图形和子图
fig, ax = plt.subplots()
ax.plot([1, 2, 3, 4, 5], [1, 4, 9, 16, 25])
ax.text(1, 20, "A", fontsize=12, weight='bold')
ax.set_title("how2matplotlib.com Example 2")
plt.show()
Output:
3. 使用循环为多个子图添加注释
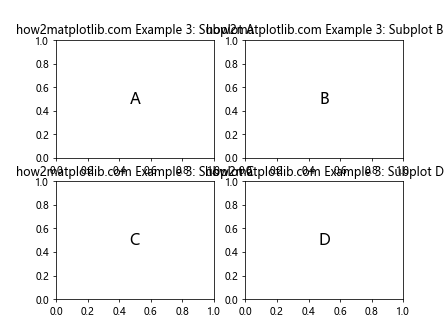
当我们有多个子图时,可以使用循环来为每个子图添加相应的注释。
示例代码 3: 为多个子图添加注释
import matplotlib.pyplot as plt

# 创建一个包含多个子图的图形
fig, axs = plt.subplots(2, 2)
annotations = ['A', 'B', 'C', 'D']
for ax, annotation in zip(axs.flat, annotations):
    ax.text(0.5, 0.5, annotation, transform=ax.transAxes, fontsize=16, va='center', ha='center')
    ax.set_title(f"how2matplotlib.com Example 3: Subplot {annotation}")
plt.show()
Output:
4. 调整注释位置
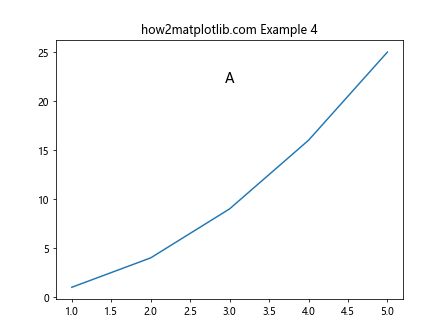
注释的位置对于图形的清晰度和美观度都非常重要。我们可以通过调整 text 方法中的参数来优化注释的位置。
示例代码 4: 调整注释位置
import matplotlib.pyplot as plt

# 创建图形和子图
fig, ax = plt.subplots()
ax.plot([1, 2, 3, 4, 5], [1, 4, 9, 16, 25])
ax.text(0.5, 0.85, "A", transform=ax.transAxes, fontsize=14, va='center', ha='center')
ax.set_title("how2matplotlib.com Example 4")
plt.show()
Output:
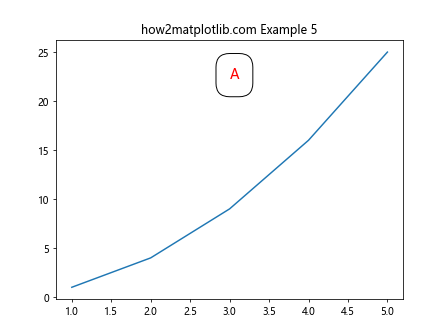
5. 使用注释样式增强视觉效果
Matplotlib 提供了多种样式选项,如颜色、字体大小、边框等,以增强注释的视觉效果。
示例代码 5: 使用样式增强注释
import matplotlib.pyplot as plt

# 创建图形和子图
fig, ax = plt.subplots()
ax.plot([1, 2, 3, 4, 5], [1, 4, 9, 16, 25])
ax.text(0.5, 0.85, "A", transform=ax.transAxes, fontsize=14, color='red', bbox=dict(facecolor='none', edgecolor='black', boxstyle='round,pad=1'))
ax.set_title("how2matplotlib.com Example 5")
plt.show()
Output:
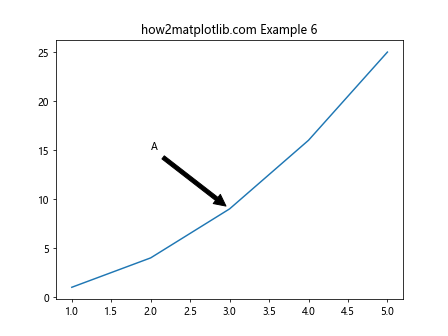
6. 在子图中使用箭头指向特定数据点
在某些情况下,我们可能需要使用箭头指向图中的特定数据点,以强调这些点的重要性。
示例代码 6: 在子图中使用箭头指向数据点
import matplotlib.pyplot as plt

# 创建图形和子图
fig, ax = plt.subplots()
ax.plot([1, 2, 3, 4, 5], [1, 4, 9, 16, 25])
ax.annotate('A', xy=(3, 9), xytext=(2, 15), arrowprops=dict(facecolor='black', shrink=0.05))
ax.set_title("how2matplotlib.com Example 6")
plt.show()
Output:
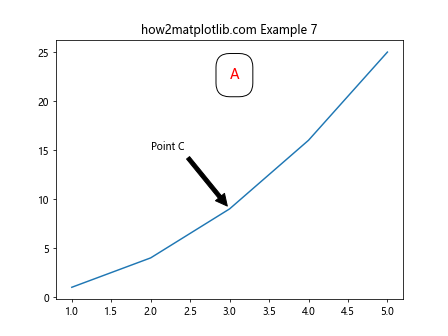
7. 结合使用多种注释技巧
在实际应用中,我们经常需要结合使用多种注释技巧来达到最佳的视觉效果。
示例代码 7: 结合使用多种注释技巧
import matplotlib.pyplot as plt

# 创建图形和子图
fig, ax = plt.subplots()
ax.plot([1, 2, 3, 4, 5], [1, 4, 9, 16, 25])
ax.text(0.5, 0.85, "A", transform=ax.transAxes, fontsize=14, color='red', bbox=dict(facecolor='none', edgecolor='black', boxstyle='round,pad=1'))
ax.annotate('Point C', xy=(3, 9), xytext=(2, 15), arrowprops=dict(facecolor='black', shrink=0.05))
ax.set_title("how2matplotlib.com Example 7")
plt.show()
Output:
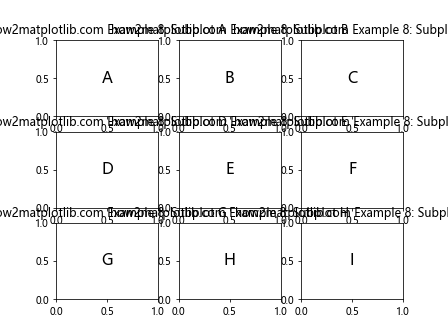
8. 在复杂布局中添加注释
当我们的图形包含复杂的布局时,正确地添加和定位注释变得尤为重要。
示例代码 8: 在复杂布局中添加注释
import matplotlib.pyplot as plt

# 创建一个包含多个子图的图形
fig, axs = plt.subplots(3, 3)
annotations = ['A', 'B', 'C', 'D', 'E', 'F', 'G', 'H', 'I']
for ax, annotation in zip(axs.flat, annotations):
    ax.text(0.5, 0.5, annotation, transform=ax.transAxes, fontsize=16, va='center', ha='center')
    ax.set_title(f"how2matplotlib.com Example 8: Subplot {annotation}")
plt.show()
Output:
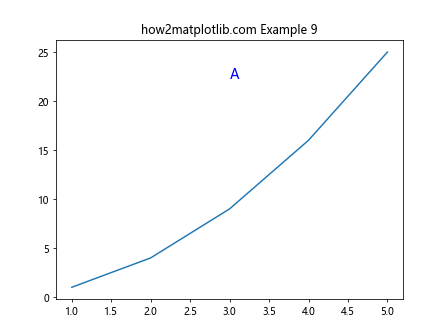
9. 使用不同的字体和样式
为了使图形更具个性化,我们可以使用不同的字体和样式来注释子图。
示例代码 9: 使用不同的字体和样式
import matplotlib.pyplot as plt

# 创建图形和子图
fig, ax = plt.subplots()
ax.plot([1, 2, 3, 4, 5], [1, 4, 9, 16, 25])
ax.text(0.5, 0.85, "A", transform=ax.transAxes, fontsize=14, fontstyle='italic', color='blue')
ax.set_title("how2matplotlib.com Example 9")
plt.show()
Output:
10. 在子图中使用不同对齐方式的注释
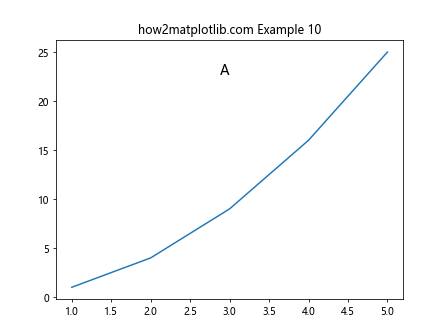
对齐方式可以影响注释的视觉效果和信息的传达方式。Matplotlib 允许我们调整文本的水平和垂直对齐方式。
示例代码 10: 使用不同对齐方式的注释
import matplotlib.pyplot as plt

# 创建图形和子图
fig, ax = plt.subplots()
ax.plot([1, 2, 3, 4, 5], [1, 4, 9, 16, 25])
ax.text(0.5, 0.85, "A", transform=ax.transAxes, fontsize=14, ha='right', va='bottom')
ax.set_title("how2matplotlib.com Example 10")
plt.show()
Output:
11. 在子图中添加多行注释
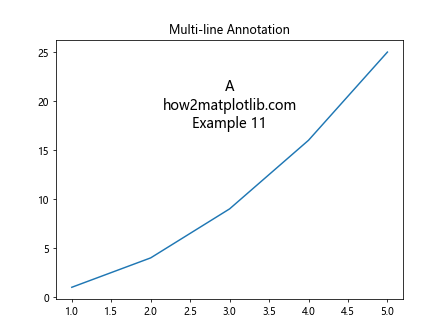
有时候,我们需要在子图中添加多行注释来提供更多的信息或解释。
示例代码 11: 在子图中添加多行注释
import matplotlib.pyplot as plt

# 创建图形和子图
fig, ax = plt.subplots()
ax.plot([1, 2, 3, 4, 5], [1, 4, 9, 16, 25])
multi_line_annotation = "A\nhow2matplotlib.com\nExample 11"
ax.text(0.5, 0.85, multi_line_annotation, transform=ax.transAxes, fontsize=14, ha='center', va='top')
ax.set_title("Multi-line Annotation")
plt.show()
Output:
12. 使用阴影效果增强注释的可读性
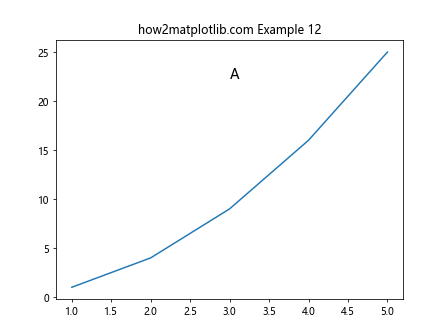
阴影效果可以使注释更加突出,增强其可读性。
示例代码 12: 使用阴影效果增强注释的可读性
import matplotlib.pyplot as plt

# 创建图形和子图
fig, ax = plt.subplots()
ax.plot([1, 2, 3, 4, 5], [1, 4, 9, 16, 25])
ax.text(0.5, 0.85, "A", transform=ax.transAxes, fontsize=14, color='black', bbox=dict(facecolor='white', alpha=0.5, edgecolor='none', boxstyle='round,pad=0.5'))
ax.set_title("how2matplotlib.com Example 12")
plt.show()
Output:
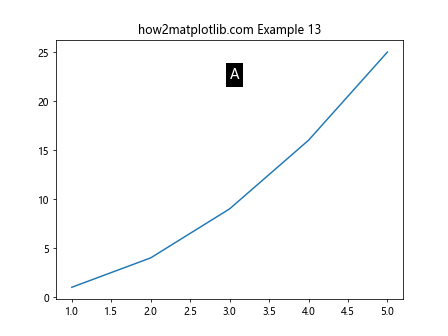
13. 在子图中使用不同颜色和背景色
使用不同的颜色和背景色可以帮助注释更好地融入或突出于整个图形之中。
示例代码 13: 使用不同颜色和背景色
import matplotlib.pyplot as plt

# 创建图形和子图
fig, ax = plt.subplots()
ax.plot([1, 2, 3, 4, 5], [1, 4, 9, 16, 25])
ax.text(0.5, 0.85, "A", transform=ax.transAxes, fontsize=14, color='white', bbox=dict(facecolor='black', edgecolor='none'))
ax.set_title("how2matplotlib.com Example 13")
plt.show()
Output:
14. 在子图中使用不同的边框样式
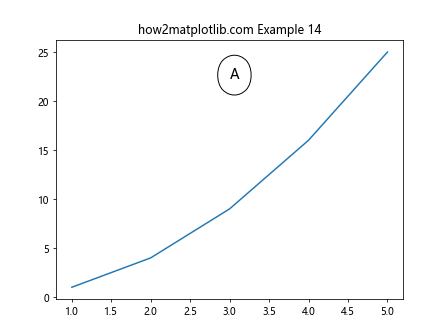
边框样式可以增强注释的视觉效果,使其更加引人注目。
示例代码 14: 使用不同的边框样式
import matplotlib.pyplot as plt

# 创建图形和子图
fig, ax = plt.subplots()
ax.plot([1, 2, 3, 4, 5], [1, 4, 9, 16, 25])
ax.text(0.5, 0.85, "A", transform=ax.transAxes, fontsize=14, bbox=dict(facecolor='white', edgecolor='black', boxstyle='round4,pad=1'))
ax.set_title("how2matplotlib.com Example 14")
plt.show()
Output:
15. 在子图中标注数据范围
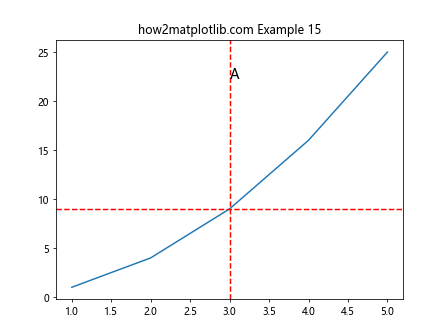
有时候,我们需要在子图中标注出特定的数据范围,以便观众能够快速理解数据的分布情况。
示例代码 15: 在子图中标注数据范围
import matplotlib.pyplot as plt

# 创建图形和子图
fig, ax = plt.subplots()
ax.plot([1, 2, 3, 4, 5], [1, 4, 9, 16, 25])
ax.text(0.5, 0.85, "A", transform=ax.transAxes, fontsize=14)
ax.axhline(y=9, color='r', linestyle='--')
ax.axvline(x=3, color='r', linestyle='--')
ax.set_title("how2matplotlib.com Example 15")
plt.show()
Output:
以上示例展示了如何在 Matplotlib 中为子图添加注释,包括不同的样式、位置和效果。通过这些技巧,你可以更有效地传达图形中的关键信息,增强图形的表现力和观众的理解。
 极客笔记
极客笔记