如何在Matplotlib中调整文本背景的透明度
参考: Adjusting Text background transparency in Matplotlib
在使用Matplotlib进行数据可视化时,通常需要在图表中添加文本来提供额外的信息或强调特定数据点。有时,为了使文本更加突出或易于阅读,我们可能需要调整文本的背景透明度。本文将详细介绍如何在Matplotlib中调整文本背景的透明度,包括多种方法和示例代码。
1. 基本文本添加与背景设置
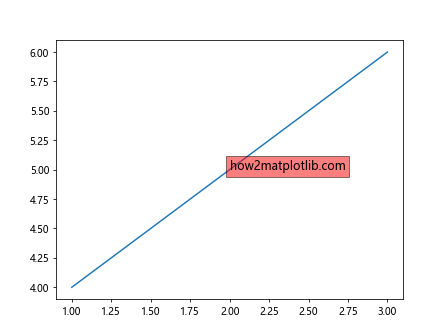
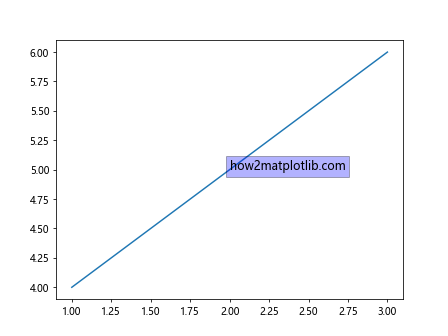
在Matplotlib中添加文本并调整背景透明度的基本方法是使用text函数,并通过bbox参数设置边框和背景样式。bbox字典中的facecolor属性用于设置背景颜色,alpha属性则用于控制背景的透明度。
示例代码 1:基本文本添加
import matplotlib.pyplot as plt

fig, ax = plt.subplots()
ax.plot([1, 2, 3], [4, 5, 6])

ax.text(2, 5, 'how2matplotlib.com', fontsize=12, bbox=dict(facecolor='red', alpha=0.5))
plt.show()
Output:
示例代码 2:调整背景透明度
import matplotlib.pyplot as plt

fig, ax = plt.subplots()
ax.plot([1, 2, 3], [4, 5, 6])

ax.text(2, 5, 'how2matplotlib.com', fontsize=12, bbox=dict(facecolor='blue', alpha=0.3))
plt.show()
Output:
2. 使用注释(Annotations)
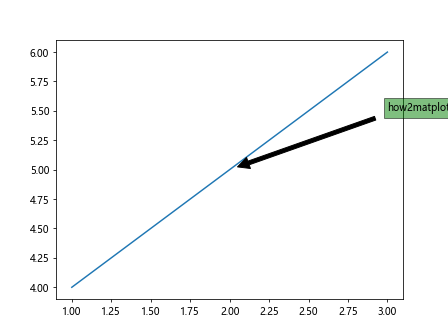
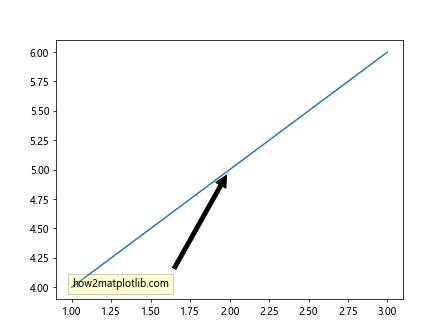
除了直接添加文本外,Matplotlib还提供了annotate函数,允许用户在图表中添加带箭头的注释。通过bbox参数同样可以设置注释文本的背景透明度。
示例代码 3:添加注释文本
import matplotlib.pyplot as plt

fig, ax = plt.subplots()
ax.plot([1, 2, 3], [4, 5, 6])

ax.annotate('how2matplotlib.com', xy=(2, 5), xytext=(3, 5.5),
            arrowprops=dict(facecolor='black', shrink=0.05),
            bbox=dict(facecolor='green', alpha=0.5))
plt.show()
Output:
示例代码 4:调整注释背景透明度
import matplotlib.pyplot as plt

fig, ax = plt.subplots()
ax.plot([1, 2, 3], [4, 5, 6])

ax.annotate('how2matplotlib.com', xy=(2, 5), xytext=(1, 4),
            arrowprops=dict(facecolor='black', shrink=0.05),
            bbox=dict(facecolor='yellow', alpha=0.2))
plt.show()
Output:
3. 复杂图形中的文本背景透明度调整
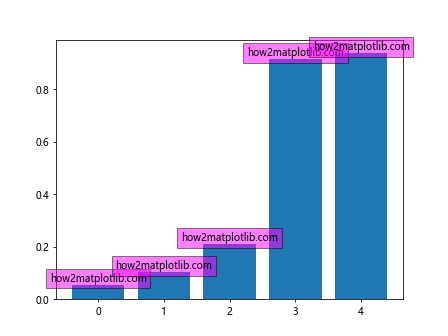
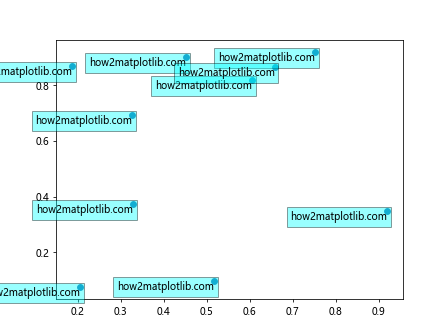
在更复杂的图形中,如条形图、饼图或散点图中添加文本时,调整背景透明度同样适用。
示例代码 5:条形图中添加文本
import matplotlib.pyplot as plt
import numpy as np

data = np.random.rand(5)
fig, ax = plt.subplots()
bars = ax.bar(range(5), data)

for i, bar in enumerate(bars):
    ax.text(bar.get_x() + bar.get_width() / 2, bar.get_height(), 'how2matplotlib.com',
            ha='center', va='bottom', bbox=dict(facecolor='magenta', alpha=0.5))

plt.show()
Output:
示例代码 6:饼图中添加文本
import matplotlib.pyplot as plt

sizes = [215, 130, 245, 210]
fig, ax = plt.subplots()
wedges, texts = ax.pie(sizes, colors=['red', 'green', 'blue', 'yellow'])

for i, wedge in enumerate(wedges):
    ax.text(wedge.get_center()[0], wedge.get_center()[1], 'how2matplotlib.com',
            ha='center', va='center', bbox=dict(facecolor='white', alpha=0.6))

plt.show()
示例代码 7:散点图中添加文本
import matplotlib.pyplot as plt
import numpy as np

x = np.random.rand(10)
y = np.random.rand(10)
fig, ax = plt.subplots()
sc = ax.scatter(x, y)

for i, (xi, yi) in enumerate(zip(x, y)):
    ax.text(xi, yi, 'how2matplotlib.com', ha='right', va='top',
            bbox=dict(facecolor='cyan', alpha=0.4))

plt.show()
Output:
4. 动态调整文本背景透明度
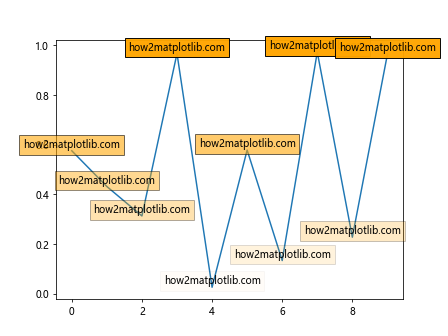
在某些情况下,我们可能需要根据图表中的其他元素动态调整文本的背景透明度。例如,可以根据数据点的值或用户的交互来调整透明度。
示例代码 8:根据数据值调整透明度
import matplotlib.pyplot as plt
import numpy as np

data = np.random.rand(10)
fig, ax = plt.subplots()
ax.plot(data)

for i, value in enumerate(data):
    alpha = value  # Use the data value as alpha
    ax.text(i, value, 'how2matplotlib.com', ha='center', va='bottom',
            bbox=dict(facecolor='orange', alpha=alpha))

plt.show()
Output:
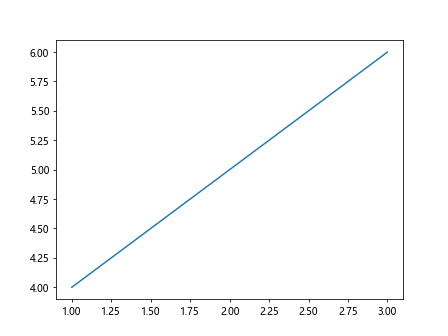
示例代码 9:交互式调整透明度
import matplotlib.pyplot as plt

def on_click(event):
    ax.text(event.xdata, event.ydata, 'how2matplotlib.com', fontsize=12,
            bbox=dict(facecolor='purple', alpha=0.7))
    fig.canvas.draw()

fig, ax = plt.subplots()
ax.plot([1, 2, 3], [4, 5, 6])
fig.canvas.mpl_connect('button_press_event', on_click)

plt.show()
Output:
5. 结论
在Matplotlib中调整文本背景的透明度是一个简单而有效的方法,可以帮助改善图表的可读性和美观性。通过本文的示例代码,我们展示了如何在不同类型的图表中添加和调整文本背景透明度,以及如何根据不同的需求动态调整透明度。
 极客笔记
极客笔记