Matplotlib柱状图添加数值标签:全面指南与实用技巧
参考:Adding value labels on a Matplotlib Bar Chart
Matplotlib是Python中最流行的数据可视化库之一,它提供了丰富的绘图功能,其中柱状图(Bar Chart)是一种常用的图表类型。在数据分析和展示中,为柱状图添加数值标签可以直观地显示每个柱子的具体数值,使图表更加信息丰富和易于理解。本文将详细介绍如何在Matplotlib柱状图中添加数值标签,包括基本方法、自定义样式、处理复杂数据等多个方面。
1. 基本柱状图及数值标签添加
首先,让我们从最基本的柱状图开始,然后逐步添加数值标签。
1.1 创建简单柱状图
创建一个简单的柱状图是添加数值标签的基础。以下是一个基本的柱状图示例:
import matplotlib.pyplot as plt
import numpy as np

categories = ['A', 'B', 'C', 'D']
values = [25, 40, 30, 55]

plt.figure(figsize=(10, 6))
plt.bar(categories, values)
plt.title('Basic Bar Chart - how2matplotlib.com')
plt.xlabel('Categories')
plt.ylabel('Values')
plt.show()
Output:
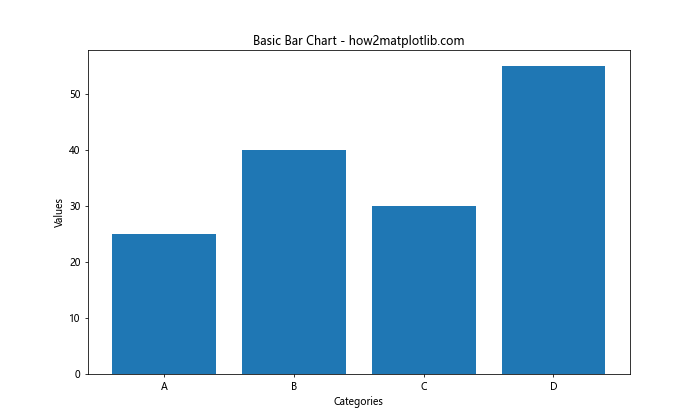
这段代码创建了一个基本的柱状图,包含四个类别和对应的数值。
1.2 添加简单数值标签
现在,让我们为这个柱状图添加数值标签:
import matplotlib.pyplot as plt
import numpy as np

categories = ['A', 'B', 'C', 'D']
values = [25, 40, 30, 55]

plt.figure(figsize=(10, 6))
bars = plt.bar(categories, values)

for bar in bars:
    height = bar.get_height()
    plt.text(bar.get_x() + bar.get_width()/2., height,
             f'{height}',
             ha='center', va='bottom')

plt.title('Bar Chart with Value Labels - how2matplotlib.com')
plt.xlabel('Categories')
plt.ylabel('Values')
plt.show()
Output:
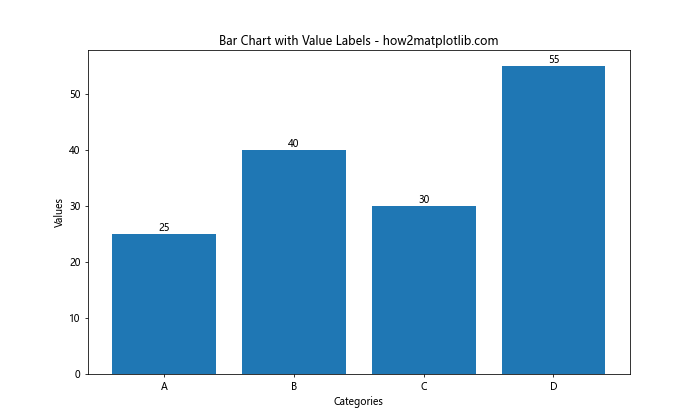
在这个例子中,我们遍历每个柱子,获取其高度,然后使用plt.text()函数在适当的位置添加文本标签。
2. 自定义数值标签样式
添加基本的数值标签后,我们可以通过调整各种参数来自定义标签的样式,使其更加美观和易读。
2.1 调整字体大小和颜色
import matplotlib.pyplot as plt
import numpy as np

categories = ['A', 'B', 'C', 'D']
values = [25, 40, 30, 55]

plt.figure(figsize=(10, 6))
bars = plt.bar(categories, values)

for bar in bars:
    height = bar.get_height()
    plt.text(bar.get_x() + bar.get_width()/2., height,
             f'{height}',
             ha='center', va='bottom',
             fontsize=12, color='red')

plt.title('Bar Chart with Styled Labels - how2matplotlib.com')
plt.xlabel('Categories')
plt.ylabel('Values')
plt.show()
Output:
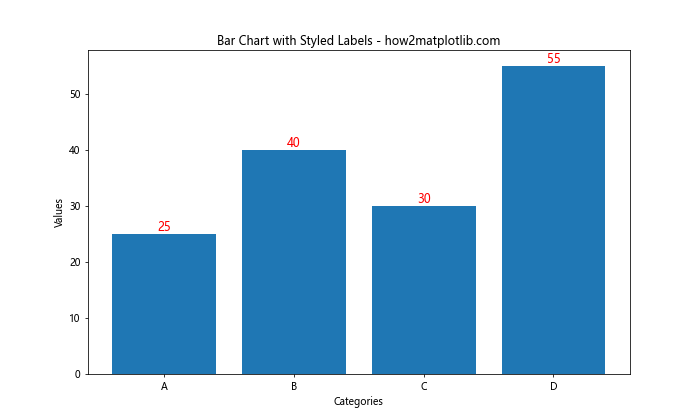
在这个例子中,我们通过设置fontsize和color参数来调整标签的字体大小和颜色。
2.2 添加背景和边框
为了使标签更加突出,我们可以为其添加背景色和边框:
import matplotlib.pyplot as plt
import numpy as np

categories = ['A', 'B', 'C', 'D']
values = [25, 40, 30, 55]

plt.figure(figsize=(10, 6))
bars = plt.bar(categories, values)

for bar in bars:
    height = bar.get_height()
    plt.text(bar.get_x() + bar.get_width()/2., height,
             f'{height}',
             ha='center', va='bottom',
             bbox=dict(facecolor='white', edgecolor='gray', boxstyle='round,pad=0.5'))

plt.title('Bar Chart with Styled Labels - how2matplotlib.com')
plt.xlabel('Categories')
plt.ylabel('Values')
plt.show()
Output:
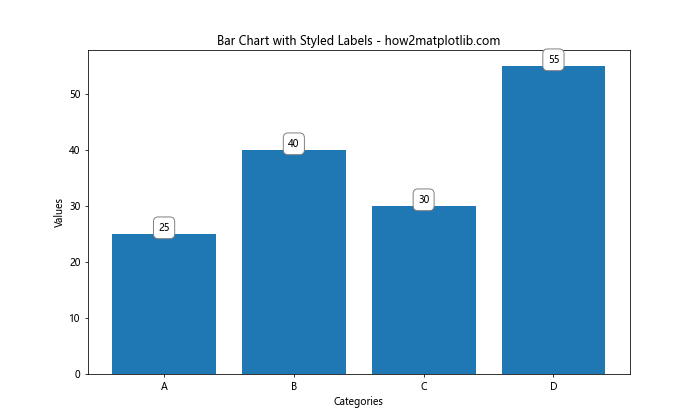
这里我们使用bbox参数为标签添加了白色背景和灰色边框,并设置了圆角样式。
3. 处理负值和零值
在实际应用中,数据可能包含负值或零值,这需要特别处理以确保标签正确显示。
3.1 处理负值
import matplotlib.pyplot as plt
import numpy as np

categories = ['A', 'B', 'C', 'D', 'E']
values = [25, -15, 30, 0, -10]

plt.figure(figsize=(10, 6))
bars = plt.bar(categories, values)

for bar in bars:
    height = bar.get_height()
    plt.text(bar.get_x() + bar.get_width()/2.,
             height if height >= 0 else height - 1,
             f'{height}',
             ha='center', va='bottom' if height >= 0 else 'top')

plt.title('Bar Chart with Negative Values - how2matplotlib.com')
plt.xlabel('Categories')
plt.ylabel('Values')
plt.axhline(y=0, color='k', linestyle='-', linewidth=0.5)
plt.show()
Output:
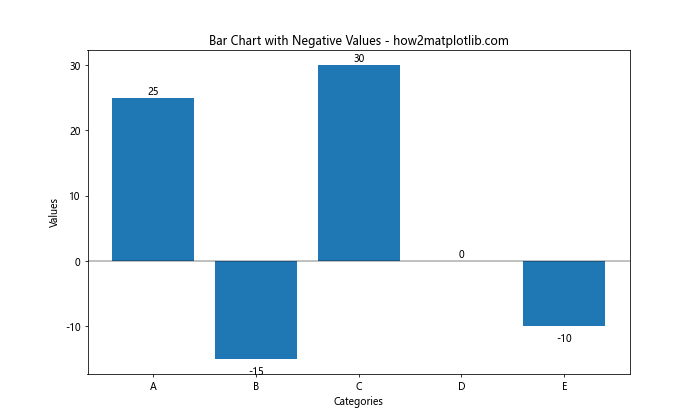
在这个例子中,我们根据值的正负来调整标签的位置,确保负值的标签显示在柱子下方。
3.2 处理零值
import matplotlib.pyplot as plt
import numpy as np

categories = ['A', 'B', 'C', 'D', 'E']
values = [25, 0, 30, 15, 0]

plt.figure(figsize=(10, 6))
bars = plt.bar(categories, values)

for bar in bars:
    height = bar.get_height()
    if height == 0:
        plt.text(bar.get_x() + bar.get_width()/2., 0.5,
                 '0',
                 ha='center', va='bottom')
    else:
        plt.text(bar.get_x() + bar.get_width()/2., height,
                 f'{height}',
                 ha='center', va='bottom')

plt.title('Bar Chart with Zero Values - how2matplotlib.com')
plt.xlabel('Categories')
plt.ylabel('Values')
plt.ylim(bottom=0)  # 确保y轴从0开始
plt.show()
Output:
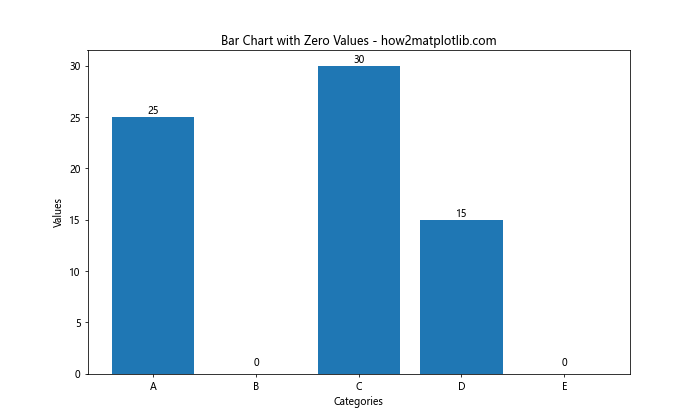
对于零值,我们将标签稍微提高一点,以确保它们可见。
4. 堆叠柱状图的标签处理
堆叠柱状图是另一种常见的图表类型,为其添加标签需要特别考虑每个部分的位置。
4.1 基本堆叠柱状图标签
import matplotlib.pyplot as plt
import numpy as np

categories = ['A', 'B', 'C', 'D']
values1 = [10, 20, 15, 25]
values2 = [15, 10, 20, 15]

plt.figure(figsize=(10, 6))
bars1 = plt.bar(categories, values1, label='Group 1')
bars2 = plt.bar(categories, values2, bottom=values1, label='Group 2')

def add_labels(bars):
    for bar in bars:
        height = bar.get_height()
        plt.text(bar.get_x() + bar.get_width()/2., bar.get_y() + height/2,
                 f'{height}',
                 ha='center', va='center')

add_labels(bars1)
add_labels(bars2)

plt.title('Stacked Bar Chart with Labels - how2matplotlib.com')
plt.xlabel('Categories')
plt.ylabel('Values')
plt.legend()
plt.show()
Output:
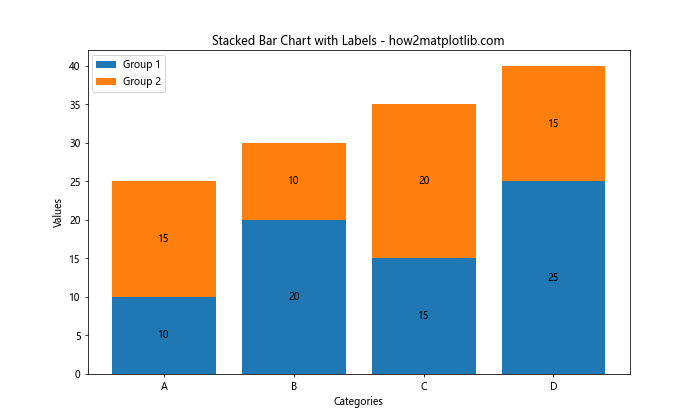
在这个例子中,我们为堆叠柱状图的每个部分添加了标签,并将标签放置在每个部分的中心。
4.2 复杂堆叠柱状图标签
对于更复杂的堆叠柱状图,我们可能需要更精细的控制:
import matplotlib.pyplot as plt
import numpy as np

categories = ['A', 'B', 'C', 'D']
values1 = [10, 20, 15, 25]
values2 = [15, 10, 20, 15]
values3 = [5, 8, 12, 10]

plt.figure(figsize=(10, 6))
bars1 = plt.bar(categories, values1, label='Group 1')
bars2 = plt.bar(categories, values2, bottom=values1, label='Group 2')
bars3 = plt.bar(categories, values3, bottom=np.array(values1) + np.array(values2), label='Group 3')

def add_labels(bars, offset=0):
    for bar in bars:
        height = bar.get_height()
        plt.text(bar.get_x() + bar.get_width()/2., bar.get_y() + height/2 + offset,
                 f'{height}',
                 ha='center', va='center', rotation=90 if height < 10 else 0)

add_labels(bars1)
add_labels(bars2)
add_labels(bars3, offset=-5)  # 稍微向下偏移,避免与顶部重叠

plt.title('Complex Stacked Bar Chart with Labels - how2matplotlib.com')
plt.xlabel('Categories')
plt.ylabel('Values')
plt.legend()
plt.show()
Output:
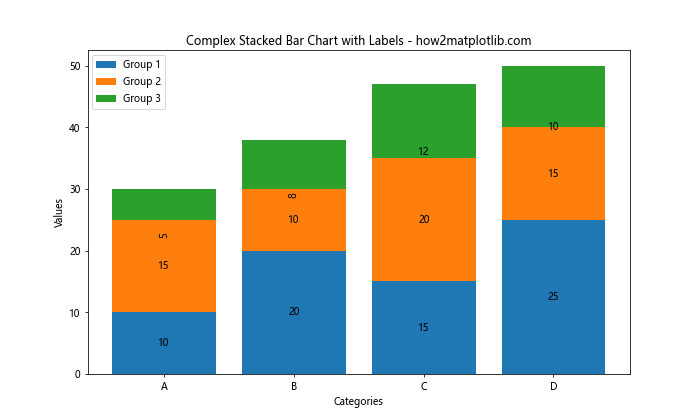
在这个更复杂的例子中,我们为三组数据添加了标签,并根据高度调整了标签的旋转角度和位置。
5. 水平柱状图的标签处理
水平柱状图在某些情况下可能更适合展示数据,尤其是当类别名称较长时。
5.1 基本水平柱状图标签
import matplotlib.pyplot as plt
import numpy as np

categories = ['Category A', 'Category B', 'Category C', 'Category D']
values = [25, 40, 30, 55]

plt.figure(figsize=(10, 6))
bars = plt.barh(categories, values)

for bar in bars:
    width = bar.get_width()
    plt.text(width, bar.get_y() + bar.get_height()/2.,
             f'{width}',
             ha='left', va='center')

plt.title('Horizontal Bar Chart with Labels - how2matplotlib.com')
plt.xlabel('Values')
plt.ylabel('Categories')
plt.show()
Output:
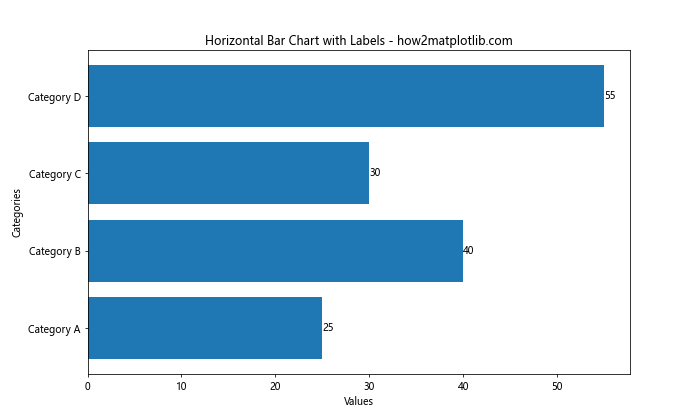
这个例子展示了如何为水平柱状图添加标签,标签位于每个柱子的右侧。
5.2 复杂水平柱状图标签
对于更复杂的水平柱状图,我们可以添加更多的自定义效果:
import matplotlib.pyplot as plt
import numpy as np

categories = ['Very Long Category A', 'Extremely Long Category B', 'Long Category C', 'Category D']
values = [250, 400, 300, 550]

plt.figure(figsize=(12, 8))
bars = plt.barh(categories, values)

for bar in bars:
    width = bar.get_width()
    plt.text(width, bar.get_y() + bar.get_height()/2.,
             f' {width:,}',  # 添加千位分隔符
             ha='left', va='center',
             bbox=dict(facecolor='white', edgecolor='gray', alpha=0.8))

plt.title('Complex Horizontal Bar Chart with Labels - how2matplotlib.com')
plt.xlabel('Values')
plt.ylabel('Categories')
plt.gca().invert_yaxis()  # 反转y轴,使最大值在顶部
plt.tight_layout()
plt.show()
Output:
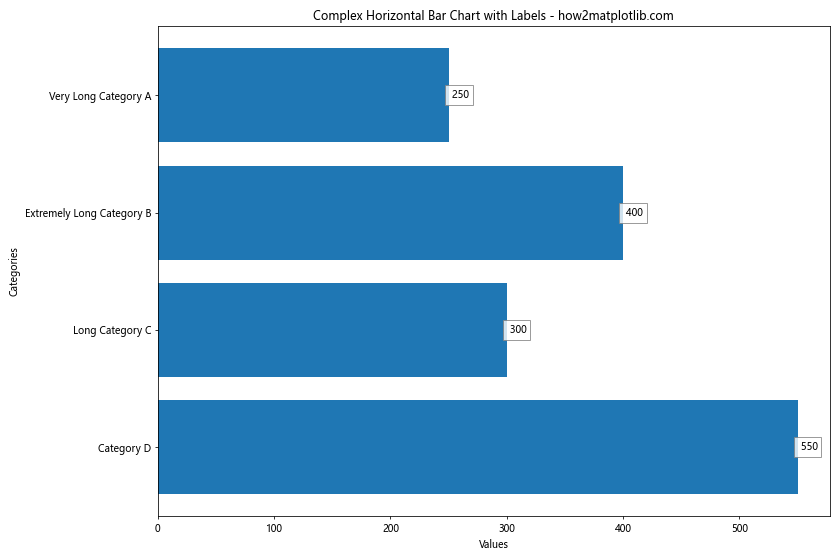
在这个例子中,我们为较长的类别名称使用了水平柱状图,并添加了带背景的标签,同时使用了千位分隔符来格式化数值。
6. 动态调整标签位置
在某些情况下,我们可能需要根据数值的大小动态调整标签的位置,以避免标签重叠或超出图表边界。
6.1 根据数值大小调整标签位置
import matplotlib.pyplot as plt
import numpy as np

categories = ['A', 'B', 'C', 'D', 'E']
values = [5, 25, 50, 75, 100]

plt.figure(figsize=(10, 6))
bars = plt.bar(categories, values)

for bar in bars:
    height = bar.get_height()
    if height < 10:
        va = 'bottom'
        y = height
    else:
        va = 'center'
        y = height / 2

    plt.text(bar.get_x() + bar.get_width()/2., y,
             f'{height}',
             ha='center', va=va)

plt.title('Bar Chart with Dynamic Label Positioning - how2matplotlib.com')
plt.xlabel('Categories')
plt.ylabel('Values')
plt.ylim(0, max(values) * 1.1)  # 稍微增加y轴范围
plt.show()
Output:
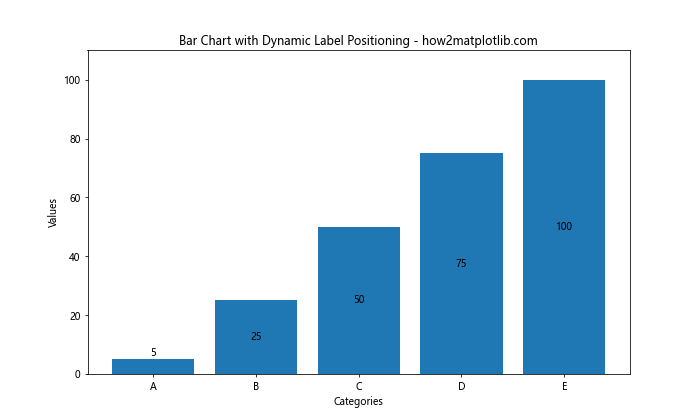
在这个例子中,我们根据柱子的高度来决定标签的垂直位置,对于较短的柱子,标签放在顶部,而对于较高的柱子,标签放在中间。
6.2 处理标签重叠
当数据点较多时,标签可能会重叠。以下是一个处理这种情况的示例:
import matplotlib.pyplot as plt
import numpy as np

categories = [f'Cat{i}' for i in range(20)]
values = np.random.randint(10, 100, 20)

plt.figure(figsize=(15, 6))
bars = plt.bar(categories, values)

for i, bar in enumerate(bars):
    height = bar.get_height()
    if i % 2 == 0:
        va = 'bottom'
        y = height
    else:
        va = 'top'
        y = 0

    plt.text(bar.get_x() + bar.get_width()/2., y,
             f'{height}',
             ha='center', va=va,
             rotation=90 if len(categories) > 10 else 0)plt.title('Bar Chart with Overlapping Labels Handling - how2matplotlib.com')
plt.xlabel('Categories')
plt.ylabel('Values')
plt.xticks(rotation=45)
plt.tight_layout()
plt.show()
在这个例子中,我们交替将标签放在柱子的顶部和底部,并在类别数量较多时旋转标签,以避免重叠。
7. 格式化标签文本
有时我们需要对标签文本进行格式化,以更好地展示数据。
7.1 添加百分号
import matplotlib.pyplot as plt
import numpy as np

categories = ['A', 'B', 'C', 'D']
values = [25.5, 40.2, 30.7, 55.1]

plt.figure(figsize=(10, 6))
bars = plt.bar(categories, values)

for bar in bars:
    height = bar.get_height()
    plt.text(bar.get_x() + bar.get_width()/2., height,
             f'{height:.1f}%',
             ha='center', va='bottom')

plt.title('Bar Chart with Percentage Labels - how2matplotlib.com')
plt.xlabel('Categories')
plt.ylabel('Percentage')
plt.show()
Output:
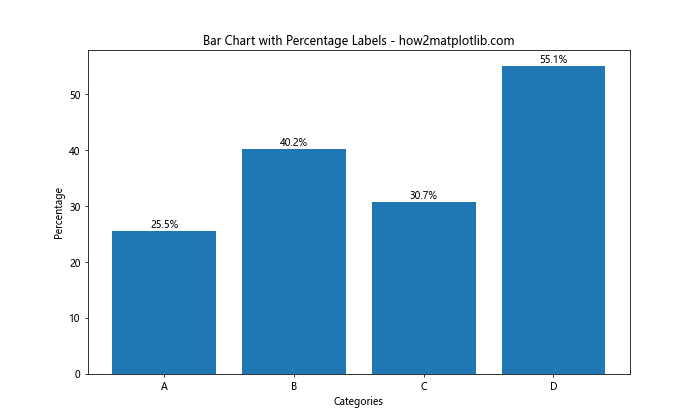
这个例子展示了如何为标签添加百分号,并限制小数位数。
7.2 使用科学记数法
对于非常大或非常小的数值,使用科学记数法可能更合适:
import matplotlib.pyplot as plt
import numpy as np

categories = ['A', 'B', 'C', 'D']
values = [1.5e6, 2.7e6, 9.8e5, 3.2e6]

plt.figure(figsize=(10, 6))
bars = plt.bar(categories, values)

for bar in bars:
    height = bar.get_height()
    plt.text(bar.get_x() + bar.get_width()/2., height,
             f'{height:.2e}',
             ha='center', va='bottom')

plt.title('Bar Chart with Scientific Notation Labels - how2matplotlib.com')
plt.xlabel('Categories')
plt.ylabel('Values')
plt.show()
Output:
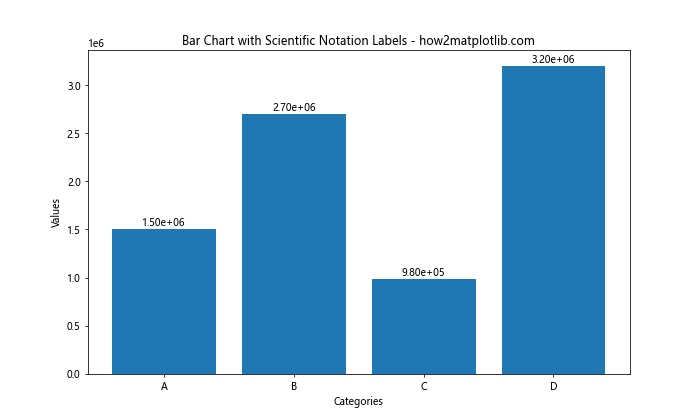
这个例子使用科学记数法来表示大数值。
8. 多系列柱状图的标签处理
当我们需要在同一图表中比较多个系列的数据时,多系列柱状图是一个很好的选择。然而,为多系列柱状图添加标签需要特别注意标签的位置和可读性。
8.1 基本多系列柱状图标签
import matplotlib.pyplot as plt
import numpy as np

categories = ['A', 'B', 'C', 'D']
series1 = [20, 35, 30, 35]
series2 = [25, 32, 34, 20]

x = np.arange(len(categories))
width = 0.35

fig, ax = plt.subplots(figsize=(12, 6))
rects1 = ax.bar(x - width/2, series1, width, label='Series 1')
rects2 = ax.bar(x + width/2, series2, width, label='Series 2')

def autolabel(rects):
    for rect in rects:
        height = rect.get_height()
        ax.annotate(f'{height}',
                    xy=(rect.get_x() + rect.get_width() / 2, height),
                    xytext=(0, 3),  # 3 points vertical offset
                    textcoords="offset points",
                    ha='center', va='bottom')

autolabel(rects1)
autolabel(rects2)

ax.set_ylabel('Values')
ax.set_title('Multi-series Bar Chart with Labels - how2matplotlib.com')
ax.set_xticks(x)
ax.set_xticklabels(categories)
ax.legend()

fig.tight_layout()
plt.show()
Output:
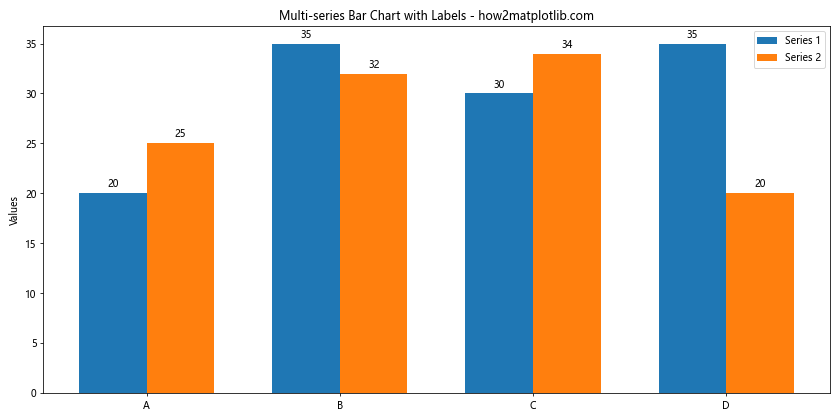
这个例子展示了如何为两个系列的柱状图添加标签,每个系列的标签都位于相应柱子的顶部。
8.2 复杂多系列柱状图标签
对于更复杂的多系列柱状图,我们可能需要更多的自定义:
import matplotlib.pyplot as plt
import numpy as np

categories = ['A', 'B', 'C', 'D']
series1 = [20, 35, 30, 35]
series2 = [25, 32, 34, 20]
series3 = [15, 28, 22, 30]

x = np.arange(len(categories))
width = 0.25

fig, ax = plt.subplots(figsize=(12, 6))
rects1 = ax.bar(x - width, series1, width, label='Series 1', color='#ff9999')
rects2 = ax.bar(x, series2, width, label='Series 2', color='#66b3ff')
rects3 = ax.bar(x + width, series3, width, label='Series 3', color='#99ff99')

def autolabel(rects):
    for rect in rects:
        height = rect.get_height()
        ax.annotate(f'{height}',
                    xy=(rect.get_x() + rect.get_width() / 2, height),
                    xytext=(0, 3),
                    textcoords="offset points",
                    ha='center', va='bottom',
                    fontsize=8,
                    bbox=dict(boxstyle="round,pad=0.3", fc="white", ec="gray", alpha=0.8))

autolabel(rects1)
autolabel(rects2)
autolabel(rects3)

ax.set_ylabel('Values')
ax.set_title('Complex Multi-series Bar Chart with Labels - how2matplotlib.com')
ax.set_xticks(x)
ax.set_xticklabels(categories)
ax.legend(loc='upper left', bbox_to_anchor=(1, 1))

plt.grid(axis='y', linestyle='--', alpha=0.7)
fig.tight_layout()
plt.show()
Output:
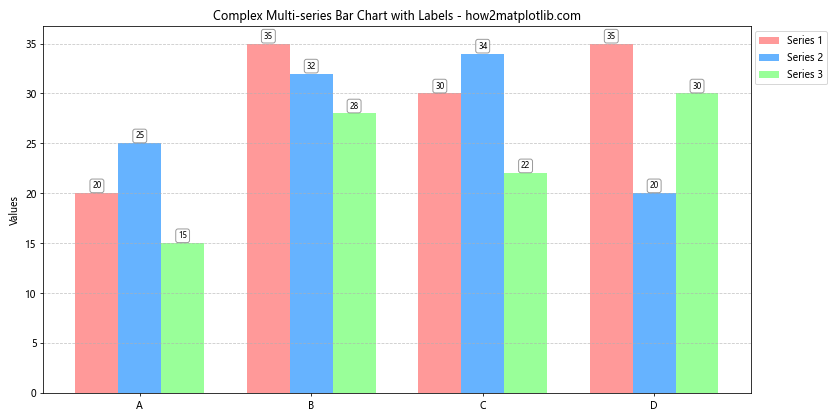
在这个更复杂的例子中,我们添加了第三个系列,使用了自定义颜色,并为标签添加了背景框以提高可读性。我们还调整了图例的位置,并添加了网格线以便更好地比较数值。
9. 动态数据的标签处理
在某些应用中,我们可能需要处理动态变化的数据。以下是一个简单的动画示例,展示如何为动态变化的柱状图添加标签。
import matplotlib.pyplot as plt
import numpy as np
from matplotlib.animation import FuncAnimation

categories = ['A', 'B', 'C', 'D']
values = [25, 40, 30, 55]

fig, ax = plt.subplots(figsize=(10, 6))

def update(frame):
    ax.clear()
    new_values = [v + np.random.randint(-5, 6) for v in values]
    bars = ax.bar(categories, new_values)

    for bar in bars:
        height = bar.get_height()
        ax.text(bar.get_x() + bar.get_width()/2., height,
                f'{height}',
                ha='center', va='bottom')

    ax.set_ylim(0, max(new_values) * 1.1)
    ax.set_title(f'Dynamic Bar Chart - Frame {frame} - how2matplotlib.com')
    ax.set_xlabel('Categories')
    ax.set_ylabel('Values')

ani = FuncAnimation(fig, update, frames=range(50), repeat=False)
plt.show()
Output:
这个例子创建了一个动态变化的柱状图,每帧都会更新数值并重新绘制标签。
10. 高级样式和布局
最后,让我们探讨一些高级的样式和布局技巧,以创建更专业和吸引人的图表。
10.1 使用自定义颜色和主题
import matplotlib.pyplot as plt
import numpy as np

plt.style.use('seaborn')

categories = ['Category A', 'Category B', 'Category C', 'Category D']
values = [25, 40, 30, 55]

colors = plt.cm.Pastel1(np.linspace(0, 1, len(categories)))

fig, ax = plt.subplots(figsize=(12, 6))
bars = ax.bar(categories, values, color=colors)

for bar in bars:
    height = bar.get_height()
    ax.text(bar.get_x() + bar.get_width()/2., height,
            f'{height}',
            ha='center', va='bottom',
            fontweight='bold', fontsize=12)

ax.set_title('Stylized Bar Chart with Labels - how2matplotlib.com', fontsize=16)
ax.set_xlabel('Categories', fontsize=14)
ax.set_ylabel('Values', fontsize=14)
ax.tick_params(axis='both', which='major', labelsize=12)

plt.tight_layout()
plt.show()
这个例子使用了Seaborn样式和自定义颜色映射来创建一个更加美观的图表。
10.2 添加数据表格
有时,在图表下方添加一个数据表格可以提供更详细的信息:
import matplotlib.pyplot as plt
import numpy as np

categories = ['A', 'B', 'C', 'D']
values = [25, 40, 30, 55]

fig, (ax_chart, ax_table) = plt.subplots(2, 1, figsize=(10, 8), gridspec_kw={'height_ratios': [3, 1]})

bars = ax_chart.bar(categories, values)

for bar in bars:
    height = bar.get_height()
    ax_chart.text(bar.get_x() + bar.get_width()/2., height,
                  f'{height}',
                  ha='center', va='bottom')

ax_chart.set_title('Bar Chart with Data Table - how2matplotlib.com')
ax_chart.set_xlabel('Categories')
ax_chart.set_ylabel('Values')

table_data = [categories, values]
table = ax_table.table(cellText=table_data,
                       colLabels=['Category', 'Value'],
                       cellLoc='center',
                       loc='center')
table.auto_set_font_size(False)
table.set_fontsize(12)
table.scale(1, 1.5)
ax_table.axis('off')

plt.tight_layout()
plt.show()
这个例子在柱状图下方添加了一个数据表格,提供了更详细的数值信息。
结论
在Matplotlib中为柱状图添加数值标签是一种强大的数据可视化技术,可以显著提高图表的信息量和可读性。通过本文介绍的各种方法和技巧,你可以创建出既美观又信息丰富的柱状图。从基本的标签添加到复杂的多系列图表,从静态图表到动态更新的动画,Matplotlib提供了丰富的工具来满足各种数据可视化需求。
记住,好的数据可视化不仅仅是展示数据,更是讲述数据背后的故事。通过恰当地使用标签,你可以引导观众关注最重要的信息点,帮助他们更好地理解和解释数据。在实际应用中,根据具体的数据特征和展示需求,灵活运用这些技巧,你将能够创建出既专业又有吸引力的数据可视化作品。
最后,不要忘记持续学习和实践。Matplotlib的功能非常丰富,本文只是涵盖了其中的一小部分。通过不断探索和尝试,你会发现更多有趣和有用的技巧,进一步提升你的数据可视化能力。
 极客笔记
极客笔记