Matplotlib中如何在图表内添加文本:全面指南
参考:Add Text Inside the Plot in Matplotlib
Matplotlib是Python中最流行的数据可视化库之一,它提供了丰富的功能来创建各种类型的图表。在数据可视化过程中,往往需要在图表内添加文本来标注重要信息、解释数据点或提供额外的上下文。本文将详细介绍如何在Matplotlib图表中添加文本,包括基本文本添加、文本属性设置、特殊文本效果以及高级文本定位技巧等。
1. 基本文本添加
在Matplotlib中,最简单的添加文本的方法是使用text()函数。这个函数允许你在图表的任意位置添加文本。
1.1 使用text()函数
text()函数的基本语法如下:
import matplotlib.pyplot as plt

fig, ax = plt.subplots()
ax.text(x, y, 'Your text here - how2matplotlib.com')
plt.show()
这里的x和y是文本在图表中的坐标位置。默认情况下,这些坐标使用数据坐标系统。
让我们看一个具体的例子:
import matplotlib.pyplot as plt

fig, ax = plt.subplots()
ax.plot([0, 1, 2, 3, 4], [0, 2, 4, 6, 8])
ax.text(2, 4, 'This is a text annotation - how2matplotlib.com')
plt.title('Simple Text Addition')
plt.xlabel('X-axis')
plt.ylabel('Y-axis')
plt.show()
Output:
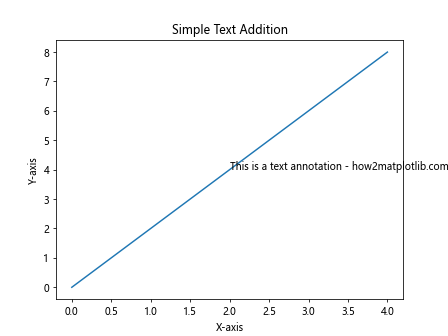
在这个例子中,我们在坐标(2, 4)处添加了一段文本。这个位置恰好位于图表的中心附近。
1.2 使用annotate()函数
annotate()函数提供了更多的灵活性,特别是当你想要指向图表中的特定点时。
import matplotlib.pyplot as plt

fig, ax = plt.subplots()
ax.plot([0, 1, 2, 3, 4], [0, 2, 4, 6, 8])
ax.annotate('Peak point - how2matplotlib.com', xy=(3, 6), xytext=(3.5, 5),
            arrowprops=dict(facecolor='black', shrink=0.05))
plt.title('Annotation Example')
plt.xlabel('X-axis')
plt.ylabel('Y-axis')
plt.show()
Output:
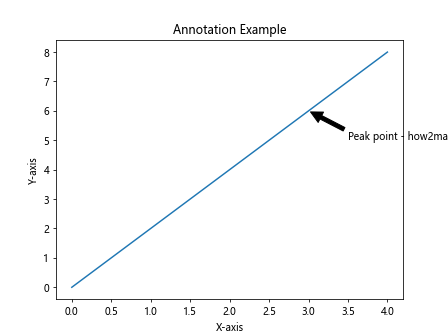
在这个例子中,我们使用annotate()函数在点(3, 6)附近添加了一个带箭头的注释。xy参数指定了箭头指向的点,而xytext参数指定了文本的位置。
2. 文本属性设置
Matplotlib提供了多种方式来自定义文本的外观,包括字体、大小、颜色等。
2.1 设置字体属性
你可以使用fontdict参数来设置文本的各种属性:
import matplotlib.pyplot as plt

fig, ax = plt.subplots()
font_dict = {'family': 'serif',
             'color':  'darkred',
             'weight': 'normal',
             'size': 16,
             }
ax.text(0.5, 0.5, 'Styled Text - how2matplotlib.com', fontdict=font_dict)
plt.title('Text with Custom Font')
plt.axis('off')
plt.show()
Output:
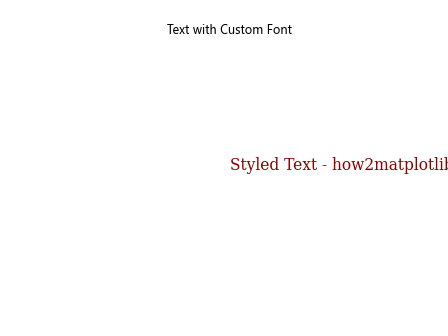
在这个例子中,我们创建了一个字典来指定文本的字体系列、颜色、粗细和大小。
2.2 使用LaTeX格式
Matplotlib支持LaTeX格式的文本,这对于添加数学公式特别有用:
import matplotlib.pyplot as plt

fig, ax = plt.subplots()
ax.text(0.5, 0.5, r'\alpha>\beta - how2matplotlib.com', fontsize=20)
plt.title('LaTeX Formatted Text')
plt.axis('off')
plt.show()
Output:
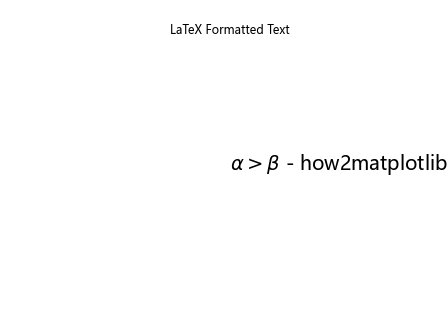
注意字符串前的r,它表示这是一个原始字符串,防止反斜杠被转义。
3. 特殊文本效果
除了基本的文本添加,Matplotlib还提供了一些特殊的文本效果,可以让你的图表更加生动和信息丰富。
3.1 文本框
你可以使用bbox参数为文本添加一个背景框:
import matplotlib.pyplot as plt

fig, ax = plt.subplots()
ax.text(0.5, 0.5, 'Text in a box - how2matplotlib.com',
        bbox={'facecolor': 'yellow', 'alpha': 0.5, 'pad': 10})
plt.title('Text with Background Box')
plt.axis('off')
plt.show()
Output:
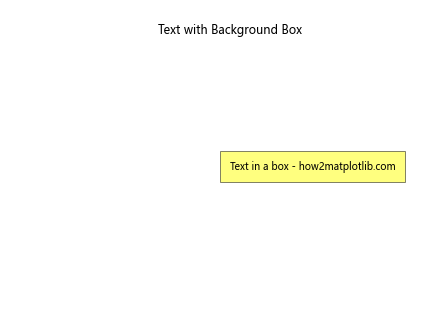
这个例子中,我们添加了一个黄色的半透明背景框。
3.2 旋转文本
有时候,你可能需要旋转文本以适应特定的布局:
import matplotlib.pyplot as plt

fig, ax = plt.subplots()
ax.text(0.5, 0.5, 'Rotated Text - how2matplotlib.com', rotation=45)
plt.title('Rotated Text Example')
plt.axis('off')
plt.show()
Output:
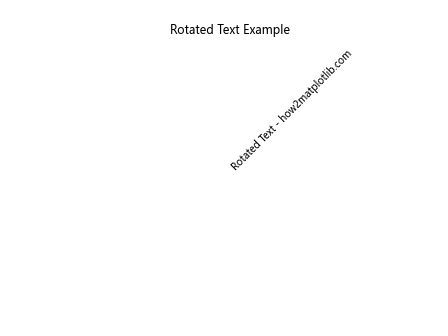
这个例子展示了如何将文本旋转45度。
3.3 多行文本
对于长文本,你可能需要将其分成多行:
import matplotlib.pyplot as plt

fig, ax = plt.subplots()
ax.text(0.5, 0.5, 'Line 1\nLine 2\nLine 3 - how2matplotlib.com',
        ha='center', va='center')
plt.title('Multi-line Text')
plt.axis('off')
plt.show()
Output:
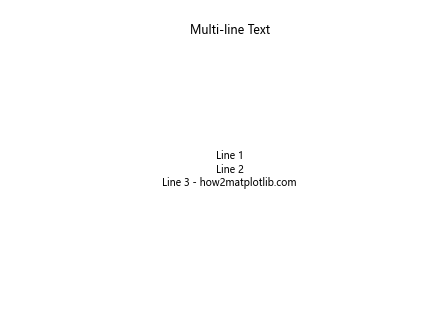
这里我们使用\n来分隔不同的行,并使用ha和va参数来控制文本的水平和垂直对齐。
4. 高级文本定位技巧
在复杂的图表中,精确定位文本可能会变得困难。Matplotlib提供了一些高级技巧来帮助你更好地控制文本位置。
4.1 使用相对坐标
你可以使用transform参数来指定相对于图表或轴的坐标:
import matplotlib.pyplot as plt

fig, ax = plt.subplots()
ax.text(0.5, 0.5, 'Center of the plot - how2matplotlib.com',
        ha='center', va='center', transform=ax.transAxes)
plt.title('Text in Relative Coordinates')
plt.show()
Output:
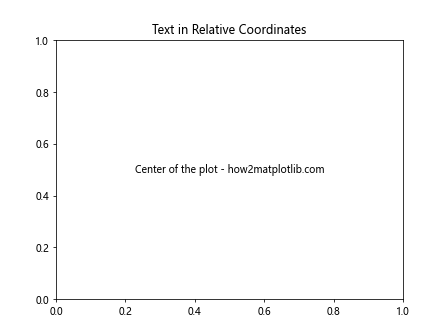
在这个例子中,transform=ax.transAxes表示坐标是相对于轴的,(0.5, 0.5)表示轴的中心。
4.2 自动调整文本位置
adjustText库提供了一种自动调整文本位置以避免重叠的方法:
import matplotlib.pyplot as plt
from adjustText import adjust_text

fig, ax = plt.subplots()
x = [1, 2, 3, 4, 5]
y = [2, 4, 1, 5, 3]
plt.scatter(x, y)

texts = []
for i, txt in enumerate(['A', 'B', 'C', 'D', 'E']):
    texts.append(plt.text(x[i], y[i], txt + ' - how2matplotlib.com'))

adjust_text(texts)
plt.title('Auto-adjusted Text Positions')
plt.show()
这个例子展示了如何使用adjustText库来自动调整文本位置,避免文本之间的重叠。
5. 文本动画
Matplotlib还支持创建文本动画,这可以用来展示随时间变化的数据或创建有趣的视觉效果。
5.1 简单文本动画
以下是一个简单的文本动画示例:
import matplotlib.pyplot as plt
import matplotlib.animation as animation

fig, ax = plt.subplots()

def animate(frame):
    ax.clear()
    ax.text(0.5, 0.5, f'Frame {frame} - how2matplotlib.com',
            ha='center', va='center')
    ax.set_xlim(0, 1)
    ax.set_ylim(0, 1)

ani = animation.FuncAnimation(fig, animate, frames=range(60), interval=50)
plt.show()
Output:
这个例子创建了一个简单的动画,文本会随着帧数的变化而更新。
6. 文本与数据交互
在数据可视化中,经常需要将文本与数据点关联起来。Matplotlib提供了多种方法来实现这一点。
6.1 为数据点添加标签
以下示例展示了如何为散点图中的每个点添加标签:
import matplotlib.pyplot as plt

fig, ax = plt.subplots()
x = [1, 2, 3, 4, 5]
y = [2, 4, 1, 5, 3]
labels = ['A', 'B', 'C', 'D', 'E']

plt.scatter(x, y)
for i, txt in enumerate(labels):
    ax.annotate(f'{txt} - how2matplotlib.com', (x[i], y[i]), xytext=(5, 5),
                textcoords='offset points')

plt.title('Scatter Plot with Point Labels')
plt.show()
Output:
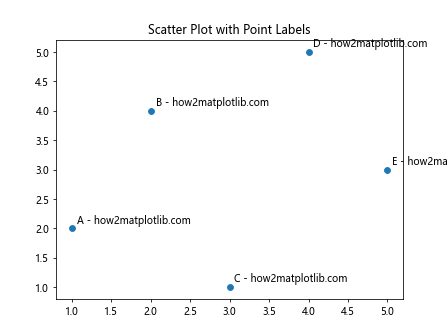
这个例子为散点图中的每个点添加了一个标签,使用xytext和textcoords参数来微调标签的位置。
6.2 动态文本更新
在交互式图表中,你可能需要根据用户的操作动态更新文本。以下是一个简单的例子:
import matplotlib.pyplot as plt
from matplotlib.widgets import Slider

fig, ax = plt.subplots()
plt.subplots_adjust(bottom=0.25)

t = ax.text(0.5, 0.5, 'Drag the slider - how2matplotlib.com', ha='center', va='center')

ax_slider = plt.axes([0.2, 0.1, 0.6, 0.03])
slider = Slider(ax_slider, 'Value', 0, 100, valinit=50)

def update(val):
    t.set_text(f'Value: {val:.2f} - how2matplotlib.com')

slider.on_changed(update)
plt.show()
Output:
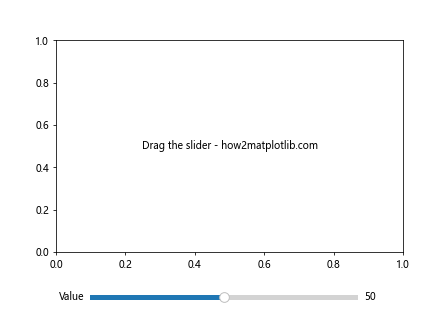
这个例子创建了一个滑块,当滑块值改变时,文本会相应地更新。
7. 文本样式和效果
Matplotlib提供了丰富的选项来自定义文本的样式和效果,使你的图表更具视觉吸引力。
7.1 文本阴影
添加文本阴影可以增加文本的可读性,特别是当文本和背景颜色相近时:
import matplotlib.pyplot as plt

fig, ax = plt.subplots()
ax.text(0.5, 0.5, 'Shadow Text - how2matplotlib.com', fontsize=20,
        ha='center', va='center', color='white',
        path_effects=[plt.patheffects.withSimplePatchShadow()])
ax.set_facecolor('lightblue')
plt.title('Text with Shadow Effect')
plt.axis('off')
plt.show()
这个例子使用path_effects参数为白色文本添加了阴影效果。
7.2 描边文本
描边效果可以使文本在复杂背景上更加突出:
import matplotlib.pyplot as plt
import matplotlib.patheffects as path_effects

fig, ax = plt.subplots()
text = ax.text(0.5, 0.5, 'Outlined Text - how2matplotlib.com', fontsize=20,
               ha='center', va='center', color='white')
text.set_path_effects([path_effects.Stroke(linewidth=3, foreground='black'),
                       path_effects.Normal()])
ax.set_facecolor('lightgreen')
plt.title('Text with Outline Effect')
plt.axis('off')
plt.show()
Output:
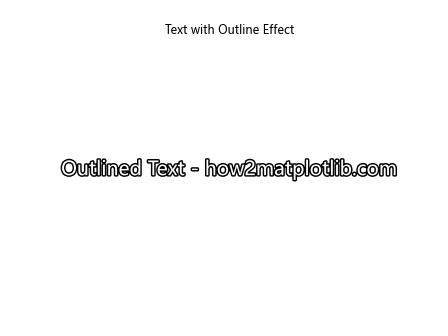
这个例子为白色文本添加了黑色描边,使其在浅绿色背景上更加醒目。
8. 文本与图形元素的结合
文本不仅可以单独使用,还可以与其他图形元素结合,创造出更丰富的视觉效果。
8.1 在条形图上添加数值标签
在条形图上添加数值标签是一种常见的做法,可以直观地显示每个条形的具体数值:
import matplotlib.pyplot as plt

fig, ax = plt.subplots()
categories = ['A', 'B', 'C', 'D']
values = [15, 30, 45, 10]

bars = ax.bar(categories, values)

for bar in bars:
    height = bar.get_height()
    ax.text(bar.get_x() + bar.get_width()/2., height,
            f'{height} - how2matplotlib.com',
            ha='center', va='bottom')

plt.title('Bar Chart with Value Labels')
plt.show()
Output:
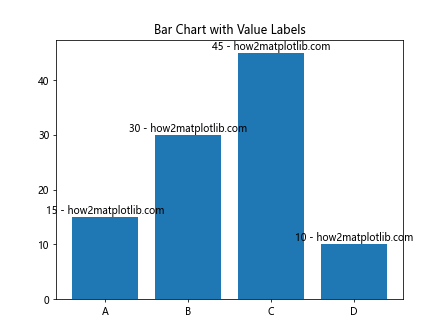
这个例子在每个条形的顶部添加了对应的数值标签。
8.2 在饼图上添加百分比标签
在饼图中添加百分比标签可以更清晰地展示各部分的占比:
import matplotlib.pyplot as plt

fig, ax = plt.subplots()
sizes = [30, 45, 15, 10]
labels = ['A', 'B', 'C', 'D']
explode = (0, 0.1, 0, 0)

wedges, texts, autotexts = ax.pie(sizes, explode=explode, labels=labels,
                                  autopct='%1.1f%% - how2matplotlib.com',
                                  textprops=dict(color="w"))

plt.setp(autotexts, size=8, weight="bold")
plt.title('Pie Chart with Percentage Labels')
plt.show()
Output:
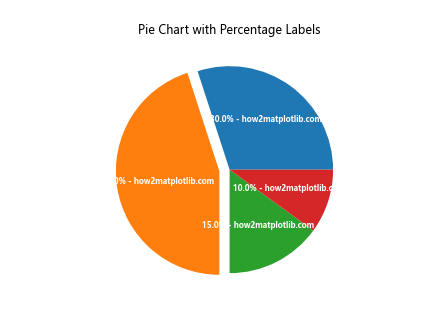
这个例子使用autopct参数自动添加了百分比标签,并使用textprops参数设置了标签的颜色和大小。
9. 文本对齐和布局
在复杂的图表中,正确对齐和布局文本元素是至关重要的。Matplotlib提供了多种方法来精确控制文本的位置和对齐方式。
9.1 文本对齐
Matplotlib允许你通过horizontalalignment(或ha)和verticalalignment(或va)参数来控制文本的对齐方式:
import matplotlib.pyplot as plt

fig, ax = plt.subplots()
alignments = ['left', 'center', 'right']
y_positions = [0.8, 0.5, 0.2]

for i, alignment in enumerate(alignments):
    ax.text(0.5, y_positions[i], f'{alignment} aligned - how2matplotlib.com',
            ha=alignment, va='center')

ax.set_xlim(0, 1)
ax.set_ylim(0, 1)
ax.set_title('Text Alignment Example')
ax.axis('off')
plt.show()
Output:
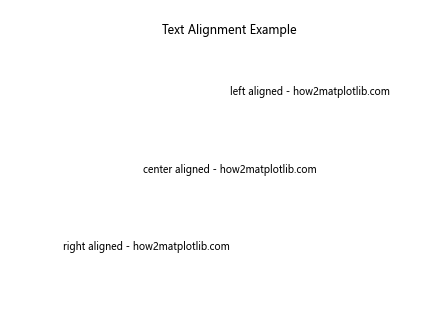
这个例子展示了左对齐、居中对齐和右对齐的文本。
9.2 文本换行和自动换行
对于长文本,你可能需要手动或自动进行换行:
import matplotlib.pyplot as plt
import textwrap

fig, (ax1, ax2) = plt.subplots(2, 1, figsize=(8, 8))

long_text = "This is a very long text that needs to be wrapped - how2matplotlib.com"

# Manual line breaks
ax1.text(0.5, 0.5, long_text.replace(' ', '\n'), ha='center', va='center')
ax1.set_title('Manual Line Breaks')
ax1.axis('off')

# Automatic text wrapping
wrapped_text = textwrap.fill(long_text, width=20)
ax2.text(0.5, 0.5, wrapped_text, ha='center', va='center')
ax2.set_title('Automatic Text Wrapping')
ax2.axis('off')

plt.tight_layout()
plt.show()
Output:
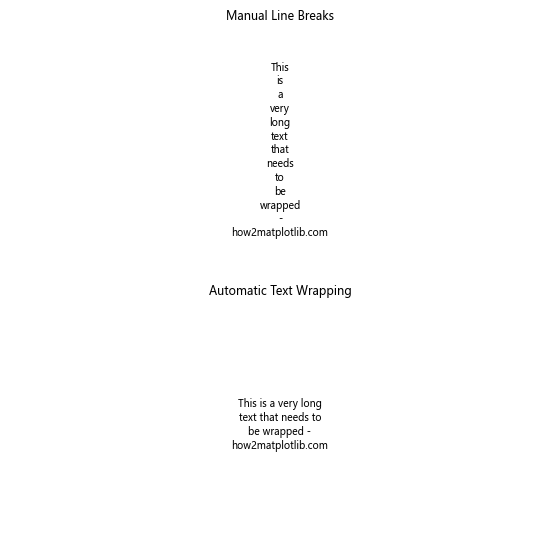
这个例子展示了如何手动换行和使用textwrap模块进行自动换行。
10. 文本与坐标系统
理解Matplotlib的不同坐标系统对于精确放置文本非常重要。
10.1 数据坐标系
默认情况下,text()函数使用数据坐标系:
import matplotlib.pyplot as plt

fig, ax = plt.subplots()
ax.plot([0, 1, 2, 3, 4], [0, 2, 4, 6, 8])
ax.text(2, 4, 'Data coordinates (2, 4) - how2matplotlib.com')
plt.title('Text in Data Coordinates')
plt.show()
Output:
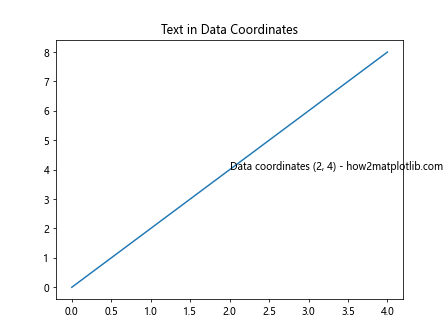
这个例子在数据点(2, 4)处添加了文本。
10.2 轴坐标系
轴坐标系使用0到1的范围来表示轴的位置:
import matplotlib.pyplot as plt

fig, ax = plt.subplots()
ax.plot([0, 1, 2, 3, 4], [0, 2, 4, 6, 8])
ax.text(0.5, 0.5, 'Axes coordinates (0.5, 0.5) - how2matplotlib.com',
        transform=ax.transAxes)
plt.title('Text in Axes Coordinates')
plt.show()
Output:
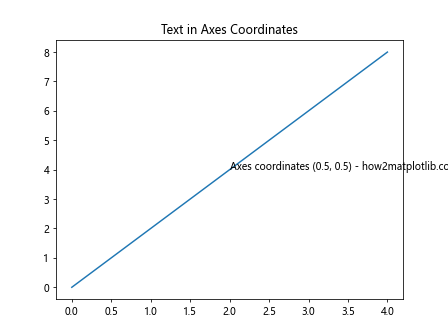
这个例子在轴的中心(0.5, 0.5)添加了文本。
10.3 图形坐标系
图形坐标系使用整个图形的坐标:
import matplotlib.pyplot as plt

fig, ax = plt.subplots()
ax.plot([0, 1, 2, 3, 4], [0, 2, 4, 6, 8])
fig.text(0.5, 0.5, 'Figure coordinates (0.5, 0.5) - how2matplotlib.com')
plt.title('Text in Figure Coordinates')
plt.show()
Output:
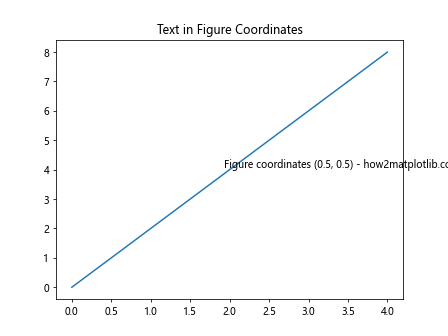
这个例子在整个图形的中心添加了文本。
11. 文本与交互式图表
在交互式图表中,文本可以用来提供动态信息或响应用户操作。
11.1 鼠标悬停文本
使用annotate()函数和mplcursors库可以创建鼠标悬停时显示的文本:
import matplotlib.pyplot as plt
import mplcursors

fig, ax = plt.subplots()
x = [1, 2, 3, 4, 5]
y = [2, 4, 1, 5, 3]
scatter = ax.scatter(x, y)

cursor = mplcursors.cursor(scatter, hover=True)

@cursor.connect("add")
def on_add(sel):
    sel.annotation.set_text(f'Point: ({sel.target[0]:.2f}, {sel.target[1]:.2f})\nhow2matplotlib.com')

plt.title('Hover Text Example')
plt.show()
Output:
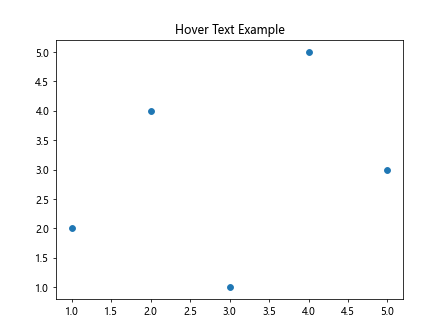
这个例子创建了一个散点图,当鼠标悬停在点上时会显示该点的坐标。
11.2 点击事件文本更新
你可以使用Matplotlib的事件处理系统来响应用户的点击操作:
import matplotlib.pyplot as plt

fig, ax = plt.subplots()
ax.set_xlim(0, 1)
ax.set_ylim(0, 1)
text = ax.text(0.5, 0.5, 'Click anywhere - how2matplotlib.com', ha='center', va='center')

def on_click(event):
    if event.inaxes == ax:
        text.set_text(f'Clicked at ({event.xdata:.2f}, {event.ydata:.2f})\nhow2matplotlib.com')
        fig.canvas.draw()

fig.canvas.mpl_connect('button_press_event', on_click)
plt.title('Click Event Text Update')
plt.show()
Output:
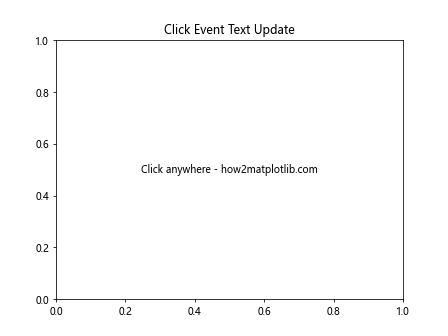
这个例子创建了一个图表,当用户点击图表时,文本会更新为点击的坐标。
12. 文本样式的全局设置
有时候,你可能想要为整个图表或甚至所有图表设置一致的文本样式。Matplotlib提供了几种方法来实现这一点。
12.1 使用rcParams
rcParams是Matplotlib的全局配置字典,你可以用它来设置默认的文本样式:
import matplotlib.pyplot as plt
import matplotlib as mpl

mpl.rcParams['font.family'] = 'serif'
mpl.rcParams['font.size'] = 12
mpl.rcParams['text.color'] = 'navy'

fig, ax = plt.subplots()
ax.text(0.5, 0.5, 'Styled text using rcParams - how2matplotlib.com', ha='center', va='center')
plt.title('Global Text Style Setting')
plt.show()
Output:
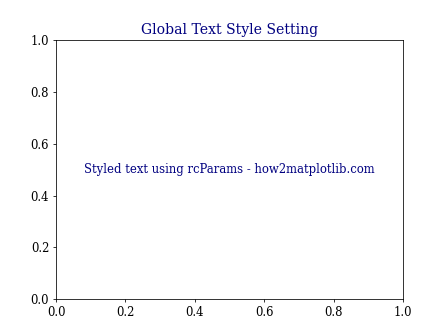
这个例子设置了全局的字体系列、大小和颜色。
12.2 使用样式表
Matplotlib的样式表提供了一种更全面的方式来设置图表的整体外观,包括文本样式:
import matplotlib.pyplot as plt

plt.style.use('seaborn')

fig, ax = plt.subplots()
ax.text(0.5, 0.5, 'Text using seaborn style - how2matplotlib.com', ha='center', va='center')
plt.title('Text Style with Stylesheet')
plt.show()
这个例子使用了’seaborn’样式,它会影响整个图表的外观,包括文本样式。
结论
在Matplotlib中添加和操作文本是数据可视化过程中的一个重要方面。通过本文介绍的各种技巧和方法,你可以在图表中精确地放置文本、自定义文本样式、创建动态文本效果,以及将文本与其他图形元素结合。这些技能将帮助你创建更加信息丰富、视觉上更具吸引力的图表。
记住,文本不仅仅是标签或标题,它是与你的受众交流的重要工具。合理使用文本可以突出关键信息、解释复杂的数据关系,并为你的可视化添加上下文。随着实践和经验的积累,你将能够更加熟练地运用这些技巧,创造出既美观又富有洞察力的数据可视化作品。
 极客笔记
极客笔记