在matplotlib中添加子图之间的空间
参考:add space between subplots matplotlib
在matplotlib中绘制子图是非常常见的操作,但有时候我们希望在子图之间添加一些空间,以便更好地展示数据。本文将详细介绍如何在matplotlib中添加子图之间的空间。
使用subplot2grid绘制子图
subplot2grid是一个用于创建基于网格布局的子图的函数。通过指定子图的位置和大小,我们可以灵活地控制子图之间的空间。
import matplotlib.pyplot as plt

plt.subplot2grid((2, 2), (0, 0))
plt.plot([1, 2, 3, 4])
plt.title('Subplot 1')

plt.subplot2grid((2, 2), (0, 1))
plt.plot([4, 3, 2, 1])
plt.title('Subplot 2')

plt.subplot2grid((2, 2), (1, 0), colspan=2)
plt.plot([1, 2, 1, 2])
plt.title('Subplot 3')

plt.tight_layout()
plt.show()
Output:
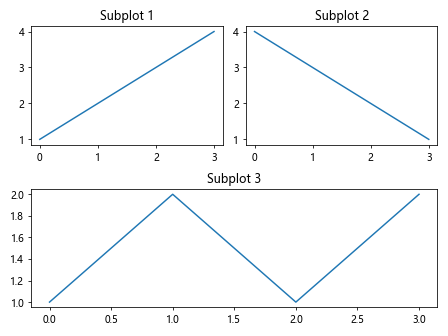
在上面的示例中,我们使用subplot2grid函数创建了一个2×2的子图布局。通过指定子图的位置和大小,我们成功地在子图之间添加了一定的空间。
使用gridspec绘制子图
除了subplot2grid函数外,我们还可以使用gridspec模块来创建复杂的子图布局。gridspec允许我们更精细地控制子图之间的空间。
import matplotlib.pyplot as plt
import matplotlib.gridspec as gridspec

fig = plt.figure()

gs = gridspec.GridSpec(2, 2)

ax1 = plt.subplot(gs[0, 0])
ax1.plot([1, 2, 3, 4])
ax1.set_title('Subplot 1')

ax2 = plt.subplot(gs[0, 1])
ax2.plot([4, 3, 2, 1])
ax2.set_title('Subplot 2')

ax3 = plt.subplot(gs[1, :])
ax3.plot([1, 2, 1, 2])
ax3.set_title('Subplot 3')

plt.tight_layout()
plt.show()
Output:
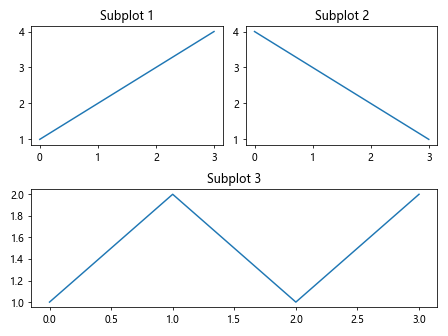
在这个示例中,我们使用gridspec模块创建了一个2×2的子图布局,通过索引控制每个子图的位置和大小。同样地,我们成功地添加了子图之间的空间。
调整子图间距
除了使用subplot2grid和gridspec来控制子图的位置和大小外,我们还可以直接调整子图之间的间距,以达到添加空间的效果。
import matplotlib.pyplot as plt

plt.subplot(211)
plt.plot([1, 2, 3, 4])
plt.title('Subplot 1')

plt.subplot(212)
plt.plot([4, 3, 2, 1])
plt.title('Subplot 2')

plt.subplots_adjust(hspace=0.5)
plt.show()
Output:
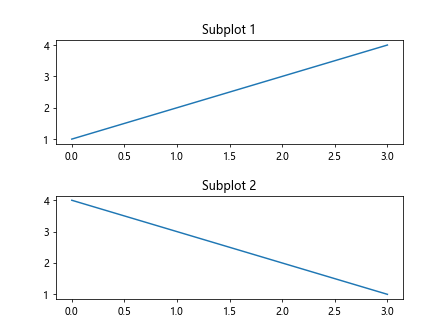
在上述示例中,我们使用subplots_adjust函数调整了子图之间的垂直间距,使得两个子图之间有更大的间隔。
使用subplots绘制多个子图
除了上面介绍的方法外,我们还可以使用subplots函数一次性创建多个子图。通过gridspec_kw参数,我们可以指定子图之间的间距。
import matplotlib.pyplot as plt

fig, axs = plt.subplots(2, 2, gridspec_kw={'hspace': 0.3, 'wspace': 0.3})

for i in range(2):
    for j in range(2):
        axs[i, j].plot([1, 2, 3, 4])
        axs[i, j].set_title(f'Subplot {i*2 + j + 1}')

plt.show()
Output:
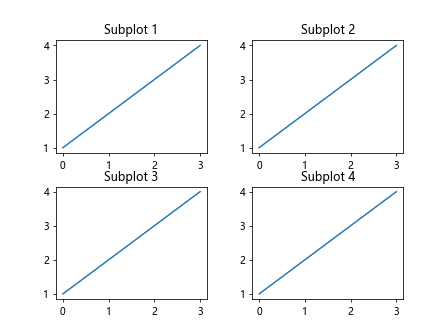
在这个示例中,我们使用subplots函数创建了一个2×2的子图布局,并通过gridspec_kw参数指定了子图之间的水平和垂直间距。
使用tight_layout自动调整子图布局
最后,我们还可以使用tight_layout函数自动调整子图布局,使得子图之间的空间更加合适。
import matplotlib.pyplot as plt

fig, axs = plt.subplots(2, 2)

for i in range(2):
    for j in range(2):
        axs[i, j].plot([1, 2, 3, 4])
        axs[i, j].set_title(f'Subplot {i*2 + j + 1}')

plt.tight_layout()
plt.show()
Output:
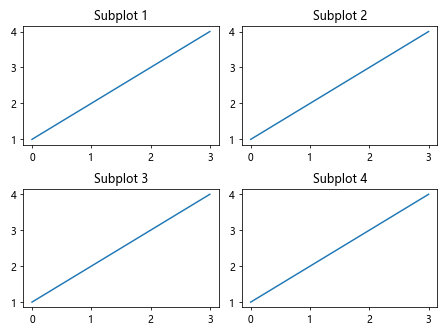
在这个示例中,我们使用tight_layout函数自动调整了子图之间的间距,使得整体布局更加美观。
通过本文的介绍,相信您已经学会了如何在matplotlib中添加子图之间的空间。无论是使用subplot2grid、gridspec,还是调整间距或使用tight_layout,都可以帮助您更好地展示数据。
 极客笔记
极客笔记