在Matplotlib / Seaborn图表中为特定单元格添加自定义边框
参考: Add a custom border to certain cells in a Matplotlib / Seaborn plot
在数据可视化中,强调特定数据点或单元格通常能帮助观众更好地理解图表的重点。Matplotlib和Seaborn是Python中最受欢迎的可视化库之一,它们提供了广泛的功能来创建高度定制的图表。本文将详细介绍如何在使用Matplotlib或Seaborn绘制的图表中为特定的单元格添加自定义边框。
1. Matplotlib基础
Matplotlib是一个非常强大的Python绘图库,它提供了大量的接口来创建和定制图形。在深入了解如何为特定单元格添加边框之前,我们首先需要了解一些Matplotlib的基础知识。
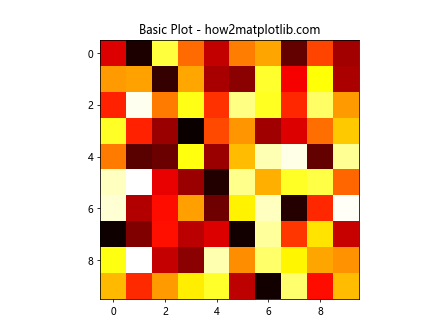
示例代码1:基础图表绘制
import matplotlib.pyplot as plt
import numpy as np

data = np.random.rand(10, 10)
plt.imshow(data, cmap='hot', interpolation='nearest')
plt.title("Basic Plot - how2matplotlib.com")
plt.show()
Output:
2. 在Matplotlib中添加边框
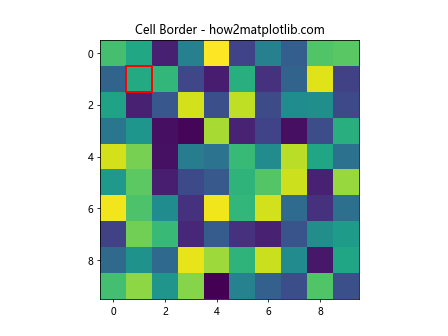
在Matplotlib中,要为图表中的特定单元格添加边框,我们可以使用patches库中的Rectangle功能来绘制矩形框。
示例代码2:为单元格添加边框
import matplotlib.pyplot as plt
import matplotlib.patches as patches
import numpy as np

fig, ax = plt.subplots()
ax.imshow(np.random.rand(10,10), cmap='viridis')
rect = patches.Rectangle((0.5, 0.5), 1, 1, linewidth=2, edgecolor='r', facecolor='none')
ax.add_patch(rect)
plt.title("Cell Border - how2matplotlib.com")
plt.show()
Output:
3. 使用Seaborn绘图
Seaborn是基于Matplotlib的高级绘图库,它提供了更多的图表类型和美化功能。虽然Seaborn主要用于统计数据可视化,但我们同样可以利用它来强调图表中的特定单元格。
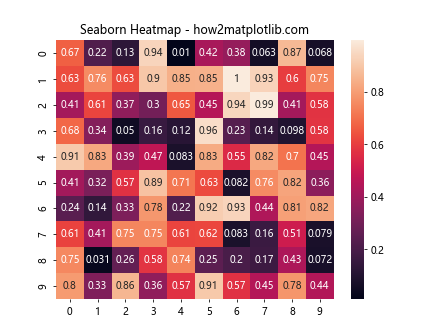
示例代码3:Seaborn热图
import matplotlib.pyplot as plt
import matplotlib.patches as patches
import numpy as np
import seaborn as sns

data = np.random.rand(10, 10)
sns.heatmap(data, annot=True)
plt.title("Seaborn Heatmap - how2matplotlib.com")
plt.show()
Output:
4. 在Seaborn图表中添加自定义边框
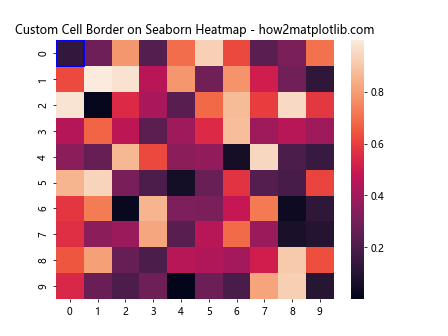
与Matplotlib类似,我们可以使用patches.Rectangle来为Seaborn图表中的单元格添加边框。
示例代码4:为Seaborn热图添加边框
import seaborn as sns
import matplotlib.pyplot as plt
import matplotlib.patches as patches
import numpy as np

data = np.random.rand(10, 10)
ax = sns.heatmap(data)
rect = patches.Rectangle((0, 0), 1, 1, linewidth=2, edgecolor='blue', facecolor='none')
ax.add_patch(rect)
plt.title("Custom Cell Border on Seaborn Heatmap - how2matplotlib.com")
plt.show()
Output:
5. 多个边框的添加
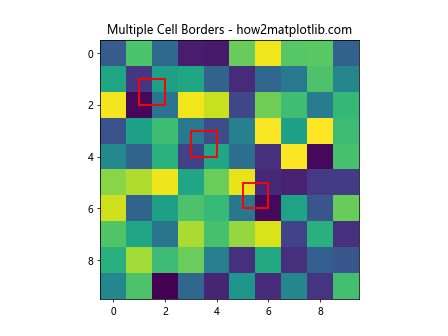
在某些情况下,我们可能需要在一个图表中为多个单元格添加边框。这可以通过在循环中创建多个Rectangle实例来实现。
示例代码5:为多个单元格添加边框
import seaborn as sns
import matplotlib.pyplot as plt
import matplotlib.patches as patches
import numpy as np

fig, ax = plt.subplots()
ax.imshow(np.random.rand(10,10), cmap='viridis')
coordinates = [(1, 1), (3, 3), (5, 5)]
for coord in coordinates:
    rect = patches.Rectangle(coord, 1, 1, linewidth=2, edgecolor='r', facecolor='none')
    ax.add_patch(rect)
plt.title("Multiple Cell Borders - how2matplotlib.com")
plt.show()
Output:
6. 结论
在本文中,我们探讨了如何在使用Matplotlib和Seaborn的图表中为特定单元格添加自定义边框。通过使用Matplotlib的patches.Rectangle功能,我们可以轻松地为图表中的任意单元格添加边框,从而突出显示重要数据。此外,这种方法也适用于Seaborn生成的图表,使其更加灵活和实用。
 极客笔记
极客笔记