Matplotlib实现Python 3D散点图绘制:全面指南
参考:3D Scatter Plotting in Python using Matplotlib
Matplotlib是Python中最流行的数据可视化库之一,它不仅能绘制2D图形,还能创建令人印象深刻的3D图表。本文将深入探讨如何使用Matplotlib绘制3D散点图,这是一种在三维空间中展示数据点分布的有效方式。我们将从基础开始,逐步深入,涵盖各种自定义选项和高级技巧,帮助你掌握3D散点图的创建和美化。
1. 3D散点图的基础
3D散点图是将数据点在三维空间中表示的图形。每个点由三个坐标值(x, y, z)确定其位置。这种图表特别适合展示三个变量之间的关系,或者在空间中可视化数据集的分布。
让我们从一个简单的例子开始:
import matplotlib.pyplot as plt
import numpy as np

# 创建一些示例数据
x = np.random.rand(100)
y = np.random.rand(100)
z = np.random.rand(100)

# 创建3D图形对象
fig = plt.figure(figsize=(10, 8))
ax = fig.add_subplot(111, projection='3d')

# 绘制散点图
scatter = ax.scatter(x, y, z)

# 设置轴标签
ax.set_xlabel('X轴 - how2matplotlib.com')
ax.set_ylabel('Y轴 - how2matplotlib.com')
ax.set_zlabel('Z轴 - how2matplotlib.com')

# 设置标题
ax.set_title('基础3D散点图 - how2matplotlib.com')

plt.show()
Output:
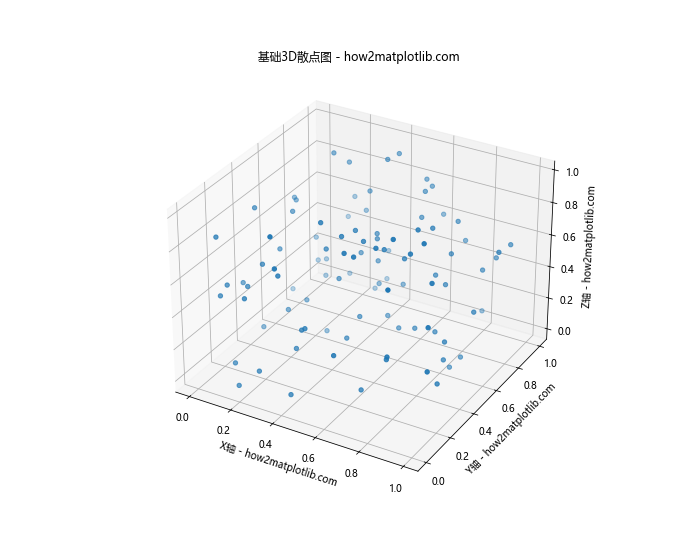
在这个例子中,我们首先导入必要的库:Matplotlib的pyplot模块和NumPy。然后,我们生成随机数据作为x、y和z坐标。接下来,我们创建一个图形对象和一个3D坐标系(通过设置projection='3d')。使用ax.scatter()函数绘制散点图,最后设置轴标签和标题。
2. 自定义点的颜色和大小
3D散点图的一个强大特性是可以通过颜色和大小来表示额外的信息维度。
import matplotlib.pyplot as plt
import numpy as np

# 创建示例数据
x = np.random.rand(100)
y = np.random.rand(100)
z = np.random.rand(100)
colors = np.random.rand(100)
sizes = 1000 * np.random.rand(100)

fig = plt.figure(figsize=(10, 8))
ax = fig.add_subplot(111, projection='3d')

# 绘制散点图,使用颜色映射和不同大小
scatter = ax.scatter(x, y, z, c=colors, s=sizes, cmap='viridis', alpha=0.6)

ax.set_xlabel('X轴 - how2matplotlib.com')
ax.set_ylabel('Y轴 - how2matplotlib.com')
ax.set_zlabel('Z轴 - how2matplotlib.com')
ax.set_title('自定义颜色和大小的3D散点图 - how2matplotlib.com')

# 添加颜色条
plt.colorbar(scatter)

plt.show()
Output:
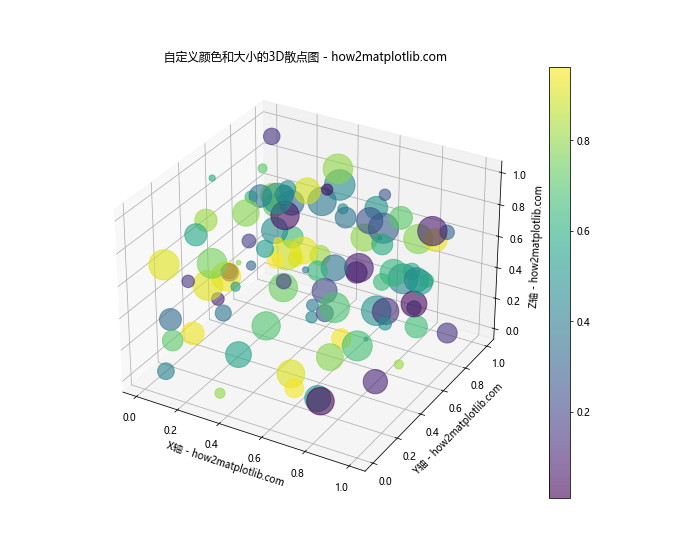
在这个例子中,我们引入了colors和sizes数组来控制每个点的颜色和大小。c参数设置颜色,s参数设置大小,cmap指定颜色映射,alpha控制透明度。最后,我们添加了一个颜色条来显示颜色与值的对应关系。
3. 添加标记和图例
为了更好地区分不同类别的数据点,我们可以使用不同的标记形状并添加图例。
import matplotlib.pyplot as plt
import numpy as np

# 创建三组数据
x1, y1, z1 = np.random.rand(3, 50)
x2, y2, z2 = np.random.rand(3, 50)
x3, y3, z3 = np.random.rand(3, 50)

fig = plt.figure(figsize=(10, 8))
ax = fig.add_subplot(111, projection='3d')

# 绘制三组散点,使用不同的标记
scatter1 = ax.scatter(x1, y1, z1, c='r', marker='o', label='Group A')
scatter2 = ax.scatter(x2, y2, z2, c='g', marker='^', label='Group B')
scatter3 = ax.scatter(x3, y3, z3, c='b', marker='s', label='Group C')

ax.set_xlabel('X轴 - how2matplotlib.com')
ax.set_ylabel('Y轴 - how2matplotlib.com')
ax.set_zlabel('Z轴 - how2matplotlib.com')
ax.set_title('带标记和图例的3D散点图 - how2matplotlib.com')

# 添加图例
ax.legend()

plt.show()
Output:
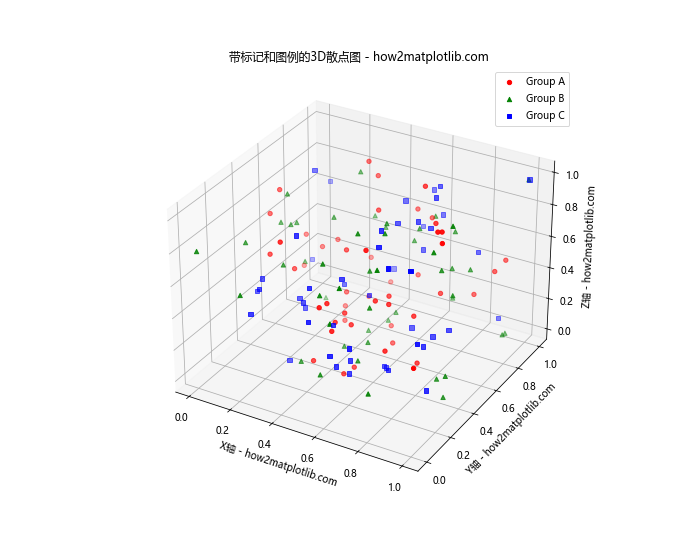
这个例子展示了如何为不同组的数据点使用不同的颜色和标记形状。我们使用label参数为每组数据指定标签,然后调用ax.legend()来显示图例。
4. 调整视角和缩放
3D图形的一个优势是可以调整视角来更好地观察数据。Matplotlib提供了几种方法来实现这一点。
import matplotlib.pyplot as plt
import numpy as np

x = np.random.rand(100)
y = np.random.rand(100)
z = np.random.rand(100)

fig = plt.figure(figsize=(15, 5))

# 创建三个子图,每个子图有不同的视角
for i, elev in enumerate([0, 30, 60]):
    ax = fig.add_subplot(131 + i, projection='3d')
    ax.scatter(x, y, z)
    ax.view_init(elev=elev, azim=45)
    ax.set_xlabel('X轴 - how2matplotlib.com')
    ax.set_ylabel('Y轴 - how2matplotlib.com')
    ax.set_zlabel('Z轴 - how2matplotlib.com')
    ax.set_title(f'仰角: {elev}° - how2matplotlib.com')

plt.tight_layout()
plt.show()
Output:
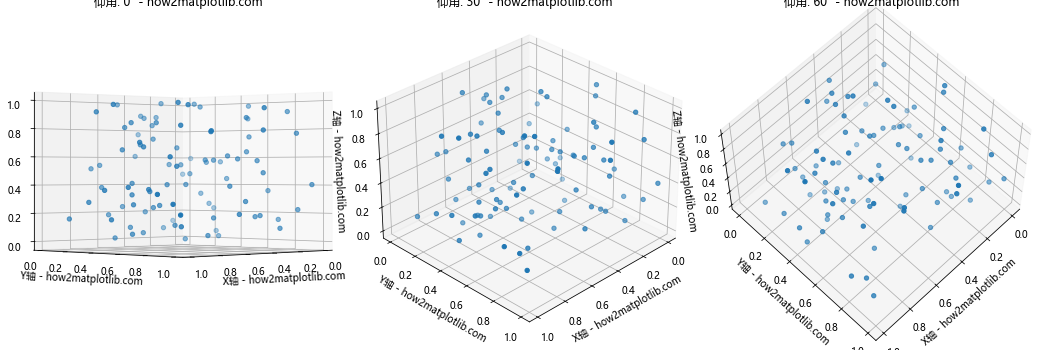
这个例子创建了三个子图,每个子图显示相同的数据但有不同的仰角(elevation)。view_init()函数用于设置视角,其中elev参数控制仰角,azim参数控制方位角。
5. 添加颜色渐变
颜色渐变可以帮助我们更直观地理解数据的分布或趋势。
import matplotlib.pyplot as plt
import numpy as np

# 创建螺旋数据
theta = np.linspace(-4 * np.pi, 4 * np.pi, 100)
z = np.linspace(-2, 2, 100)
r = z**2 + 1
x = r * np.sin(theta)
y = r * np.cos(theta)

fig = plt.figure(figsize=(10, 8))
ax = fig.add_subplot(111, projection='3d')

# 使用z值作为颜色映射
scatter = ax.scatter(x, y, z, c=z, cmap='viridis')

ax.set_xlabel('X轴 - how2matplotlib.com')
ax.set_ylabel('Y轴 - how2matplotlib.com')
ax.set_zlabel('Z轴 - how2matplotlib.com')
ax.set_title('带颜色渐变的3D螺旋散点图 - how2matplotlib.com')

# 添加颜色条
plt.colorbar(scatter)

plt.show()
Output:
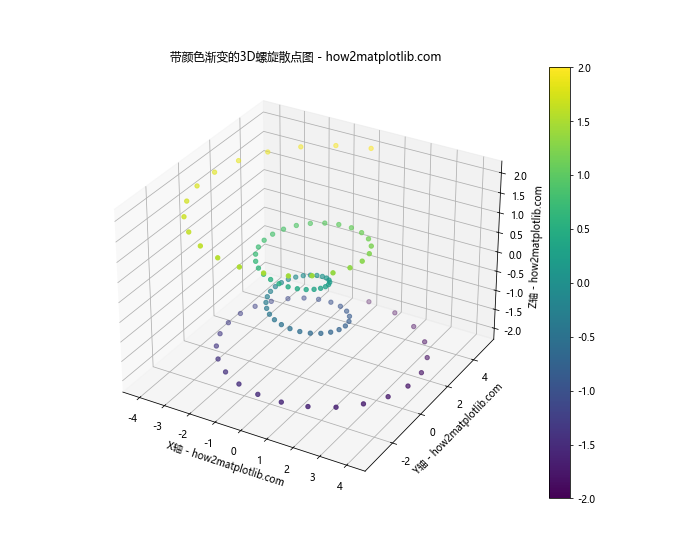
在这个例子中,我们创建了一个3D螺旋,并使用z坐标值来决定每个点的颜色。这样可以清晰地展示z值的变化。
6. 自定义坐标轴
有时我们需要自定义坐标轴的范围、刻度或标签,以更好地展示数据。
import matplotlib.pyplot as plt
import numpy as np

x = np.random.rand(100) * 100
y = np.random.rand(100) * 100
z = np.random.rand(100) * 100

fig = plt.figure(figsize=(10, 8))
ax = fig.add_subplot(111, projection='3d')

scatter = ax.scatter(x, y, z)

# 设置坐标轴范围
ax.set_xlim(0, 100)
ax.set_ylim(0, 100)
ax.set_zlim(0, 100)

# 设置刻度
ax.set_xticks([0, 25, 50, 75, 100])
ax.set_yticks([0, 25, 50, 75, 100])
ax.set_zticks([0, 25, 50, 75, 100])

# 设置标签
ax.set_xlabel('X轴 (单位: m) - how2matplotlib.com')
ax.set_ylabel('Y轴 (单位: m) - how2matplotlib.com')
ax.set_zlabel('Z轴 (单位: m) - how2matplotlib.com')

ax.set_title('自定义坐标轴的3D散点图 - how2matplotlib.com')

plt.show()
Output:
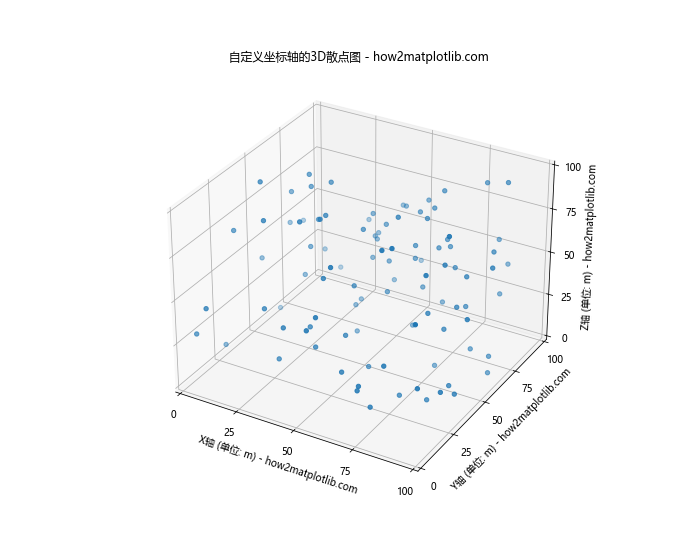
这个例子展示了如何设置坐标轴的范围(使用set_xlim()等函数)、刻度(使用set_xticks()等函数)以及自定义标签。
7. 添加文本标注
在3D散点图中添加文本标注可以帮助突出显示特定的数据点或区域。
import matplotlib.pyplot as plt
import numpy as np

x = np.random.rand(20)
y = np.random.rand(20)
z = np.random.rand(20)

fig = plt.figure(figsize=(10, 8))
ax = fig.add_subplot(111, projection='3d')

scatter = ax.scatter(x, y, z)

# 为一些点添加文本标注
for i in range(5):
    ax.text(x[i], y[i], z[i], f'Point {i+1}', fontsize=9)

ax.set_xlabel('X轴 - how2matplotlib.com')
ax.set_ylabel('Y轴 - how2matplotlib.com')
ax.set_zlabel('Z轴 - how2matplotlib.com')
ax.set_title('带文本标注的3D散点图 - how2matplotlib.com')

plt.show()
Output:
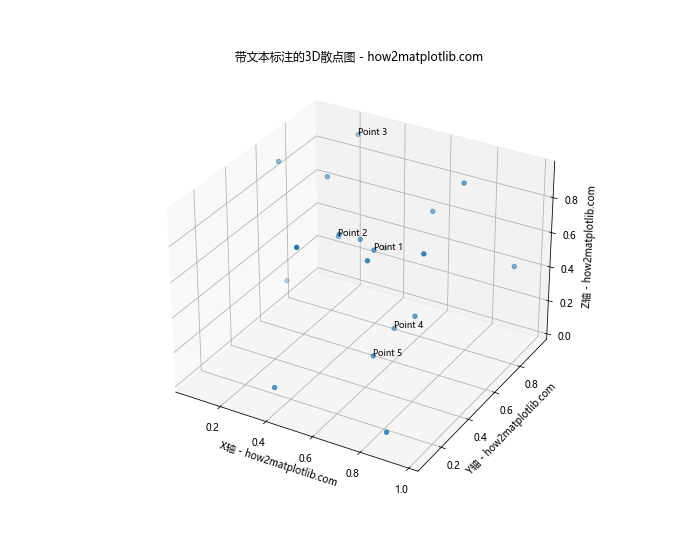
在这个例子中,我们使用ax.text()函数为前5个点添加了文本标注。你可以调整文本的位置、大小和其他属性来优化显示效果。
8. 绘制3D表面和散点的组合
有时,将3D散点与其他3D图形元素(如表面)结合可以提供更丰富的信息。
import matplotlib.pyplot as plt
import numpy as np

# 创建表面数据
x = np.linspace(-5, 5, 50)
y = np.linspace(-5, 5, 50)
X, Y = np.meshgrid(x, y)
Z = np.sin(np.sqrt(X**2 + Y**2))

# 创建散点数据
x_scatter = np.random.rand(100) * 10 - 5
y_scatter = np.random.rand(100) * 10 - 5
z_scatter = np.sin(np.sqrt(x_scatter**2 + y_scatter**2)) + np.random.normal(0, 0.1, 100)

fig = plt.figure(figsize=(12, 9))
ax = fig.add_subplot(111, projection='3d')

# 绘制表面
surf = ax.plot_surface(X, Y, Z, cmap='viridis', alpha=0.7)

# 绘制散点
scatter = ax.scatter(x_scatter, y_scatter, z_scatter, c='red', s=50)

ax.set_xlabel('X轴 - how2matplotlib.com')
ax.set_ylabel('Y轴 - how2matplotlib.com')
ax.set_zlabel('Z轴 - how2matplotlib.com')
ax.set_title('3D表面和散点的组合图 - how2matplotlib.com')

plt.colorbar(surf)
plt.show()
Output:
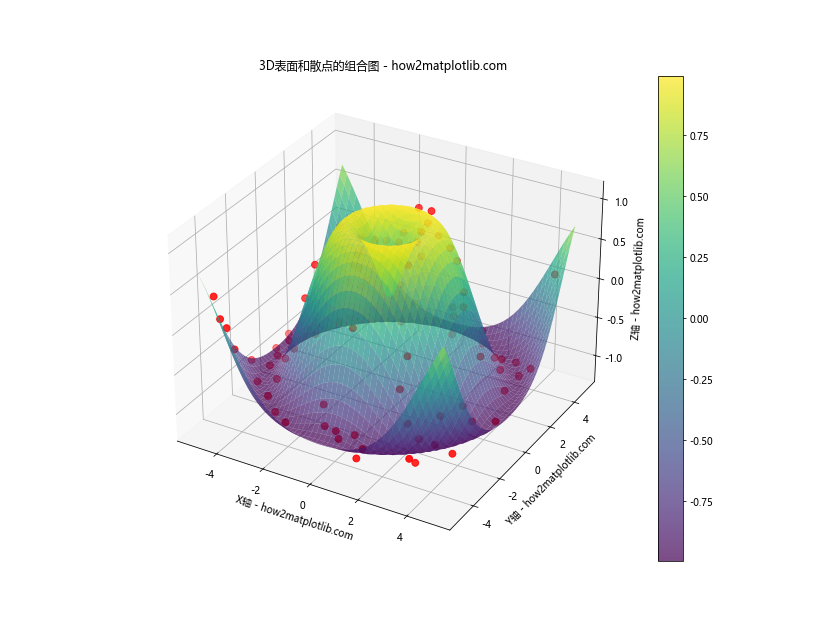
这个例子展示了如何将3D散点图与3D表面图结合。表面图使用plot_surface()函数绘制,而散点图叠加在表面之上。这种组合可以帮助我们比较实际数据点与理论模型的差异。
9. 动态3D散点图
虽然Matplotlib主要用于静态图形,但我们也可以创建简单的动画效果来展示3D散点图的动态变化。
import matplotlib.pyplot as plt
import numpy as np
from matplotlib.animation import FuncAnimation

# 初始化数据
n_points = 100
x = np.random.rand(n_points)
y = np.random.rand(n_points)
z = np.random.rand(n_points)

fig = plt.figure(figsize=(10, 8))
ax = fig.add_subplot(111, projection='3d')
scatter = ax.scatter(x, y, z)

ax.set_xlabel('X轴 - how2matplotlib.com')
ax.set_ylabel('Y轴 - how2matplotlib.com')
ax.set_zlabel('Z轴 - how2matplotlib.com')
ax.set_title('动态3D散点图 - how2matplotlib.com')

# 更新函数
def update(frame):
    global x, y, z
    x += np.random.normal(0, 0.01, n_points)
    y += np.random.normal(0, 0.01, n_points)
    z += np.random.normal(0, 0.01, n_points)
    scatter._offsets3d = (x, y, z)
    return scatter,

# 创建动画
anim = FuncAnimation(fig, update, frames=200, interval=50, blit=True)

plt.show()
Output:
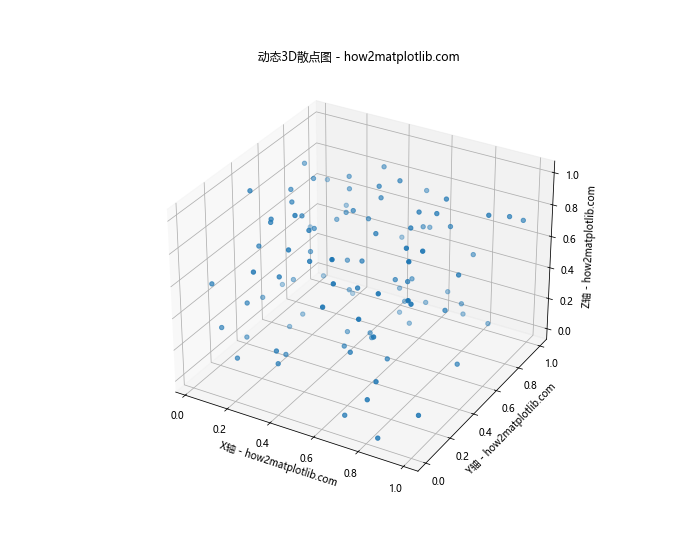
这个例子创建了一个动态的3D散点图,其中点的位置在每一帧都会稍微变化。我们使用FuncAnimation类来创建动画,update函数定义了每一帧的变化。
10. 使用不同形状的标记
3D散点图中使用不同形状的标记可以帮助区分不同类别的数据点。
import matplotlib.pyplot as plt
import numpy as np

# 创建数据
n_points = 100
x = np.random.rand(n_points)
y = np.random.rand(n_points)
z = np.random.rand(n_points)

# 创建不同的类别
categories = np.random.choice(['A', 'B', 'C', 'D'], n_points)

fig = plt.figure(figsize=(12, 9))
ax = fig.add_subplot(111, projection='3d')

# 为每个类别定义不同的标记和颜色
markers = {'A': 'o', 'B': 's', 'C': '^', 'D': 'D'}
colors = {'A': 'red', 'B': 'blue', 'C': 'green', 'D': 'purple'}

for cat in ['A', 'B', 'C', 'D']:
    mask = categories == cat
    ax.scatter(x[mask], y[mask], z[mask],
               marker=markers[cat], c=colors[cat], label=f'Category {cat}')

ax.set_xlabel('X轴 - how2matplotlib.com')
ax.set_ylabel('Y轴 - how2matplotlib.com')
ax.set_zlabel('Z轴 - how2matplotlib.com')
ax.set_title('使用不同形状标记的3D散点图 - how2matplotlib.com')
ax.legend()

plt.show()
Output:
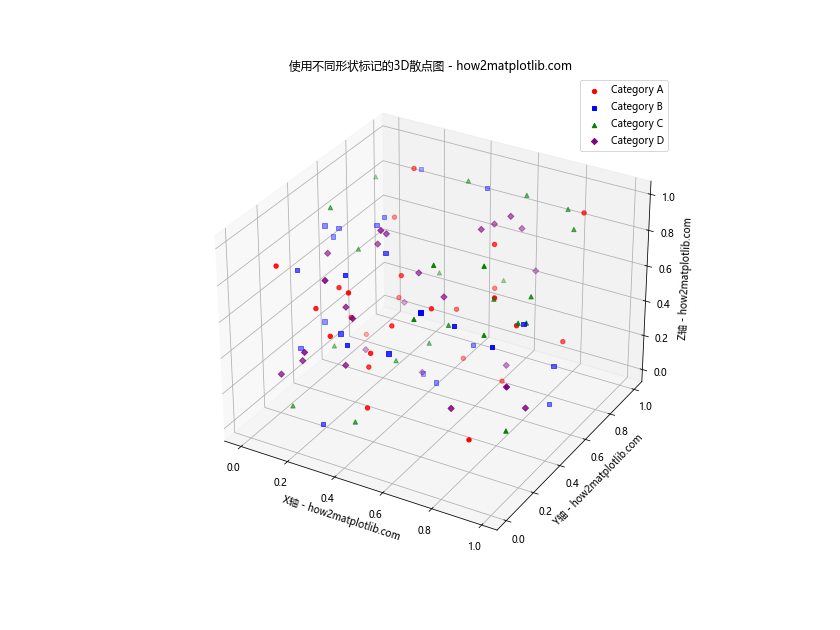
这个例子展示了如何为不同类别的数据点使用不同的标记形状和颜色。我们为每个类别定义了特定的标记和颜色,然后分别绘制每个类别的散点。
11. 添加投影
在3D散点图中添加投影可以帮助我们更好地理解点在各个平面上的分布。
import matplotlib.pyplot as plt
import numpy as np

# 创建数据
n_points = 100
x = np.random.rand(n_points)
y = np.random.rand(n_points)
z = np.random.rand(n_points)

fig = plt.figure(figsize=(12, 9))
ax = fig.add_subplot(111, projection='3d')

# 绘制3D散点
scatter = ax.scatter(x, y, z, c='blue', s=50)

# 添加x-y平面的投影
ax.scatter(x, y, np.zeros_like(z), c='red', s=20, alpha=0.3)

# 添加x-z平面的投影
ax.scatter(x, np.ones_like(y), z, c='green', s=20, alpha=0.3)

# 添加y-z平面的投影
ax.scatter(np.zeros_like(x), y, z, c='orange', s=20, alpha=0.3)

ax.set_xlabel('X轴 - how2matplotlib.com')
ax.set_ylabel('Y轴 - how2matplotlib.com')
ax.set_zlabel('Z轴 - how2matplotlib.com')
ax.set_title('带投影的3D散点图 - how2matplotlib.com')

plt.show()
Output:
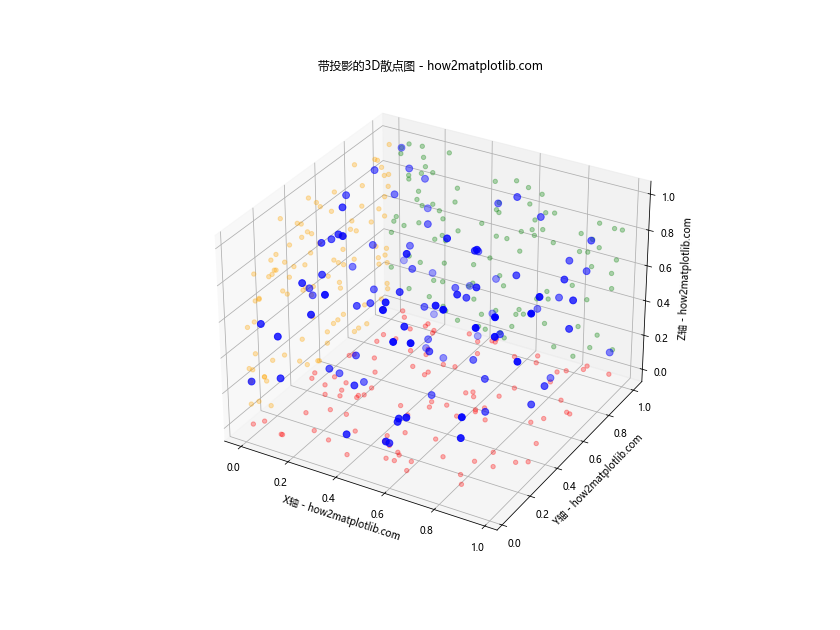
在这个例子中,我们在三个主平面上添加了点的投影。这些投影使用较小的点大小和较低的透明度,以便与主要的3D散点区分开来。
12. 使用颜色映射表示第四维数据
3D散点图可以通过颜色来表示第四维的数据,这对于可视化高维数据非常有用。
import matplotlib.pyplot as plt
import numpy as np

# 创建数据
n_points = 1000
x = np.random.rand(n_points)
y = np.random.rand(n_points)
z = np.random.rand(n_points)
values = x*y*z  # 第四维数据

fig = plt.figure(figsize=(12, 9))
ax = fig.add_subplot(111, projection='3d')

# 使用颜色映射绘制散点
scatter = ax.scatter(x, y, z, c=values, cmap='viridis', s=50)

ax.set_xlabel('X轴 - how2matplotlib.com')
ax.set_ylabel('Y轴 - how2matplotlib.com')
ax.set_zlabel('Z轴 - how2matplotlib.com')
ax.set_title('使用颜色表示第四维的3D散点图 - how2matplotlib.com')

# 添加颜色条
cbar = plt.colorbar(scatter)
cbar.set_label('值 (x*y*z)')

plt.show()
Output:
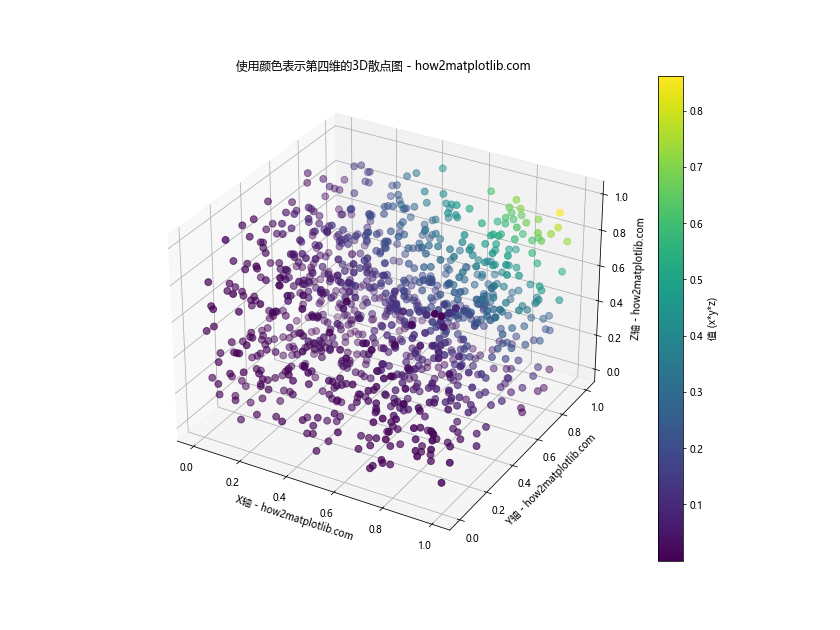
在这个例子中,我们使用x*y*z的值作为第四维数据,并通过颜色映射来表示。颜色条显示了颜色与值的对应关系。
13. 绘制3D向量场
虽然不是严格意义上的散点图,但3D向量场可以看作是一种特殊的3D点图,每个点都有一个方向。
import matplotlib.pyplot as plt
import numpy as np

# 创建网格
x, y, z = np.meshgrid(np.arange(-0.8, 1, 0.2),
                      np.arange(-0.8, 1, 0.2),
                      np.arange(-0.8, 1, 0.2))

# 定义向量场
u = np.sin(np.pi * x) * np.cos(np.pi * y) * np.cos(np.pi * z)
v = -np.cos(np.pi * x) * np.sin(np.pi * y) * np.cos(np.pi * z)
w = (np.sqrt(2.0 / 3.0) * np.cos(np.pi * x) * np.cos(np.pi * y) *
     np.sin(np.pi * z))

fig = plt.figure(figsize=(12, 9))
ax = fig.add_subplot(111, projection='3d')

# 绘制向量场
ax.quiver(x, y, z, u, v, w, length=0.1, normalize=True)

ax.set_xlabel('X轴 - how2matplotlib.com')
ax.set_ylabel('Y轴 - how2matplotlib.com')
ax.set_zlabel('Z轴 - how2matplotlib.com')
ax.set_title('3D向量场 - how2matplotlib.com')

plt.show()
Output:
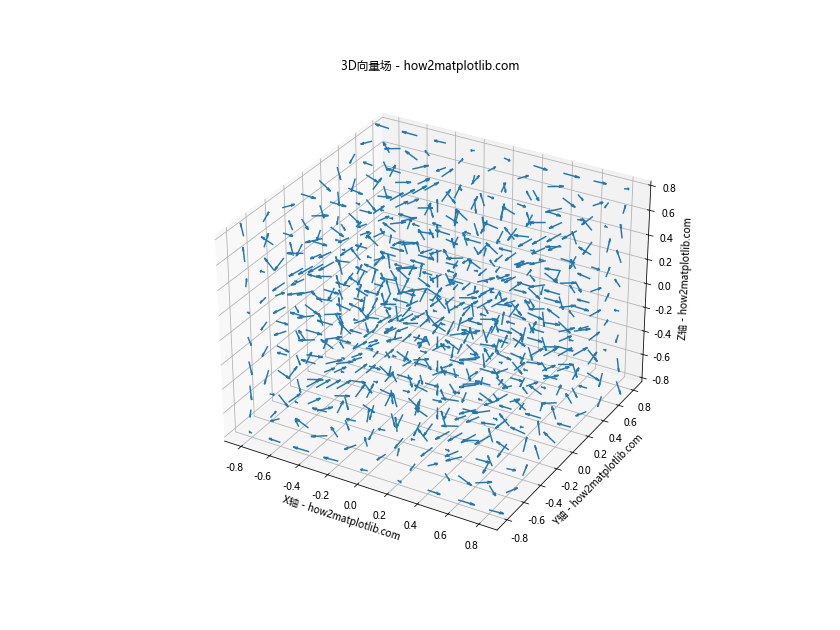
这个例子展示了如何使用quiver()函数绘制3D向量场。每个箭头代表一个向量,其方向由u、v、w分量决定。
14. 绘制3D等高线图与散点图的组合
将3D散点图与等高线图结合可以帮助我们更好地理解数据的分布和趋势。
import matplotlib.pyplot as plt
import numpy as np

# 创建网格数据
x = np.linspace(-5, 5, 100)
y = np.linspace(-5, 5, 100)
X, Y = np.meshgrid(x, y)
Z = np.sin(np.sqrt(X**2 + Y**2))

# 创建散点数据
n_points = 50
x_scatter = np.random.uniform(-5, 5, n_points)
y_scatter = np.random.uniform(-5, 5, n_points)
z_scatter = np.sin(np.sqrt(x_scatter**2 + y_scatter**2)) + np.random.normal(0, 0.1, n_points)

fig = plt.figure(figsize=(12, 9))
ax = fig.add_subplot(111, projection='3d')

# 绘制等高线图
contour = ax.contour(X, Y, Z, zdir='z', offset=-2, cmap='viridis')

# 绘制散点图
scatter = ax.scatter(x_scatter, y_scatter, z_scatter, c='red', s=50)

ax.set_xlabel('X轴 - how2matplotlib.com')
ax.set_ylabel('Y轴 - how2matplotlib.com')
ax.set_zlabel('Z轴 - how2matplotlib.com')
ax.set_title('3D等高线图与散点图的组合 - how2matplotlib.com')

# 设置z轴范围以显示等高线
ax.set_zlim(-2, 1)

plt.colorbar(contour, ax=ax, shrink=0.6, aspect=20)
plt.show()
Output:
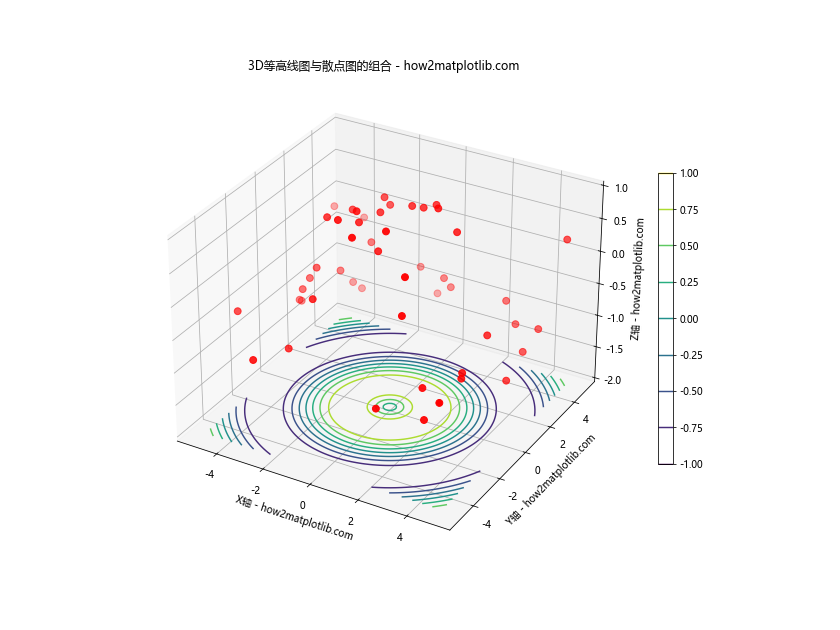
这个例子展示了如何将3D散点图与底部的等高线图结合。等高线图使用contour()函数绘制,并设置在z轴的底部。散点图则显示在3D空间中。
15. 使用不同大小和颜色的气泡图
气泡图是散点图的一种变体,其中点的大小可以表示另一个维度的数据。
import matplotlib.pyplot as plt
import numpy as np

# 创建数据
n_points = 50
x = np.random.rand(n_points)
y = np.random.rand(n_points)
z = np.random.rand(n_points)
size = 1000 * np.random.rand(n_points)
colors = np.random.rand(n_points)

fig = plt.figure(figsize=(12, 9))
ax = fig.add_subplot(111, projection='3d')

# 绘制气泡图
scatter = ax.scatter(x, y, z, s=size, c=colors, alpha=0.6, cmap='viridis')

ax.set_xlabel('X轴 - how2matplotlib.com')
ax.set_ylabel('Y轴 - how2matplotlib.com')
ax.set_zlabel('Z轴 - how2matplotlib.com')
ax.set_title('3D气泡图 - how2matplotlib.com')

# 添加颜色条
cbar = plt.colorbar(scatter)
cbar.set_label('颜色值')

plt.show()
Output:
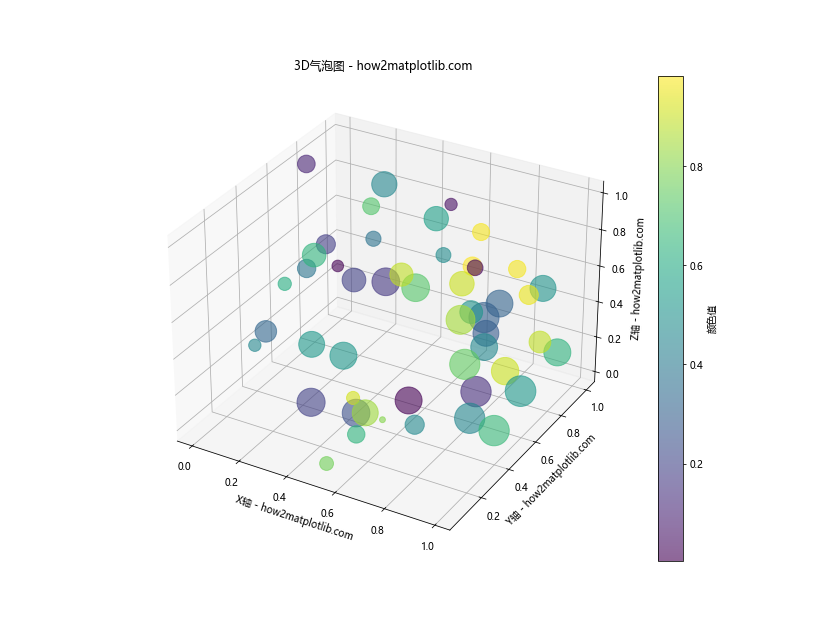
在这个例子中,我们使用s参数来控制气泡的大小,c参数来控制颜色。这样,我们可以在一个图中展示五个维度的数据:x、y、z坐标,气泡大小和颜色。
结论
通过本文,我们详细探讨了如何使用Matplotlib创建各种类型的3D散点图。从基础的散点图到复杂的多维数据可视化,我们涵盖了多种技术和方法。这些技巧不仅可以帮助你更好地展示数据,还能让你的可视化更加生动和信息丰富。
记住,3D可视化虽然强大,但也要谨慎使用。在某些情况下,多个2D图表可能比单个复杂的3D图表更容易理解。选择正确的可视化方法取决于你的数据和你想传达的信息。
最后,Matplotlib的3D绘图功能还有很多我们没有涉及的方面。我鼓励你继续探索,尝试不同的参数组合,以创建最适合你数据的可视化效果。随着实践的增加,你将能够创建更加复杂和富有洞察力的3D散点图。
 极客笔记
极客笔记